Effect of health education on costs of treatment and household´s income among tuberculosis patients in Kenya: a randomized control trial
Humphrey Mbuti Kimani, Elizabeth Mwaniki, Francis Oguya, Peterson Warutere
Corresponding author: Humphrey Mbuti Kimani, Technical University of Kenya, Department of Health Systems Management and Public Health, Nairobi, Kenya 
Received: 22 Dec 2021 - Accepted: 13 Mar 2022 - Published: 16 May 2022
Domain: Community health,Public health
Keywords: Household´s costs, direct costs, indirect costs, catastrophic costs
©Humphrey Mbuti Kimani et al. PAMJ-One Health (ISSN: 2707-2800). This is an Open Access article distributed under the terms of the Creative Commons Attribution International 4.0 License (https://creativecommons.org/licenses/by/4.0/), which permits unrestricted use, distribution, and reproduction in any medium, provided the original work is properly cited.
Cite this article: Humphrey Mbuti Kimani et al. Effect of health education on costs of treatment and household´s income among tuberculosis patients in Kenya: a randomized control trial. PAMJ-One Health. 2022;8:2. [doi: 10.11604/pamj-oh.2022.8.2.32925]
Available online at: https://www.one-health.panafrican-med-journal.com/content/article/8/2/full
Research 

Effect of health education on costs of treatment and household´s income among tuberculosis patients in Kenya: a randomized control trial
Effect of health education on costs of treatment and household´s income among tuberculosis patients in Kenya: a randomized control trial
![]() Humphrey Mbuti Kimani1,&, Elizabeth Mwaniki1, Francis Oguya1, Peterson Warutere2
Humphrey Mbuti Kimani1,&, Elizabeth Mwaniki1, Francis Oguya1, Peterson Warutere2
&Corresponding author
Introduction: directly observed therapy, short-course strategy for TB treatment, in combination with patient education has proved to be effective in reducing TB incident than the DOTS strategy alone. Although tuberculosis care for patients is free in Kenya, other expenses associated with the disease during treatment have been known to increase costs at the patient and household level. This study sought to determine effect of health education on costs to treatment and household´s income among tuberculosis patients in Kenya.
Methods: the study was conducted between September 2019 and February 2020 in selected public health facilities in Kenya. A cluster randomized controlled trial preceded by cross-sectional study was conducted among the TB patients. Four hundred and fifty (450) patients were recruited from the TB clinics by random sampling. Three hundred and seventy-three (373) met eligibility criteria and were assigned into experimental and control groups by simple random sampling. Health education intervention was given to the experimental group and not in the control group. However, all the study patients (experimental and control) received the standard tuberculosis treatment. After six months of treatment the two groups were compared.
Results: at the baseline, patients incurred almost similar total treatment costs (experimental (USD 16,071) and control (USD 16,543) groups but after the health education intervention, patients in the experimental group were found to have incurred less cost (USD 59,073) than those in the control group (USD 67,750). The difference was statistically significant (p=0.001).
Conclusion: health education was found to impart knowledge to the patient contributing to reduced expenditure while seeking TB care.

Despite being a curable disease, Tuberculosis (TB) is still a major global public health and economic concern. Although effective anti-tuberculosis agents have been available for over thirty years, the incident rate of the disease is still increasing [1]. Globally, there were an estimated 9.4 million new cases in 2015, and 1.7 million people died from the disease in the same year. Achieving universal access to quality diagnosis and treatment, and reducing the human suffering and social economic burden associated with TB, are key objectives of the current stop TB strategy [2]. According to the WHO, geographical, social/cultural, health system and economic barriers are associated with poor access to TB care. Economic barriers may come from administrative charges, transport, accommodation and subsistence cost, and lost income, productivity and time [3]. Due to a combination of economic decline, insufficient application of control measures and the HIV/AIDS pandemic, TB incidence is on the rise [3]. In Kenya the National Tuberculosis Program (NTP) decisions on what treatment regimens to follow are often based only on costs to the health system. The costs for patients of TB treatment have largely been ignored, although such costs often exceed the costs to the health system [4]. Household interventions with health services and the costs people incur due to TB illness, remains central to the performance of health care interventions, particularly their coverage and equity implications. Individuals suffering from TB are often in their economically most productive age, and seeking TB care poses a significant economic burden to patients and households [4]. As cost barriers may deter patients particularly the poor, from using the health services, these services are often infective in reaching the poor than for those who are better off. In the present study, the objective was to determine whether health education intervention had an effect on the costs associated with patient´s treatment and household´s income in the course of TB infection. According to the first Kenya TB patient cost survey report [5] and costs of TB disease in the European Union and related cost analysis and calculations [6] costs associated with TB treatment are classified as direct medical costs (consultation fees, diagnostic tests etc.), direct non-medical costs (travel, accommodation while seeking care) and indirect costs (productivity hours´ loss).

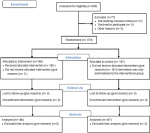
The Consolidated Standards of Reporting Trials (CONSORT) checklist and flow diagram (Figure 1) were used in reporting the results from this analysis.
Study design: the study was a cluster randomized controlled trial preceded by cross-sectoral study whose aim was to identify baseline information of participants. Blinding was not done in this study because the health education program was interactive and participatory in nature. Patients were given counselling and other relevant health information geared towards adopting appropriate health behavior. The TB clinics that were identified for the study were selected randomly. The patients who participated in the study were recruited from the TB attendance and treatment registers. Thereafter, they were assigned to experimental and control groups on a 1:1 ratio. The pre-test (baseline survey) was conducted on the two groups to establish baseline data of the patients. Health education intervention was then introduced to the experimental group. No such intervention was given to the control group. However, both groups continued to receive the normal TB treatment medication. The health education intervention was delivered in the form of individualized health messages and counseling. Education intervention was conducted during patient´s monthly follow-up appointments in outpatient clinics. The two groups were tracked to observe changes as they went on with treatment. After the study period (six months) the experimental and control groups were then assessed (post-test) to observe the differences in the treatment effect as a result of the health education intervention. The study ran from September 2019 to February 2020.
Eligibility criteria of participants: to qualify for inclusion into the study, the patient had to be an adult (18 years and above) and under directly observed treatment, short-course strategy. Further, the patient was registered in the TB attendance and treatment register for at least two weeks. The study excluded patients that were underage, those diagnosed with Multiple Drug Resistant TB (MDR-TB), HIV and those who were participating in other interventional studies.
Study setting: the study was carried out in the republic of Kenya. Kenya was identified for the study as it´s among the high TB burden countries, with a prevalence rate of 558 people per 100,000 population. The study targeted 4149 tuberculosis patients who attended TB clinics in public health facilities.
Sampling technique: the study adopted the multi-stage sampling technique. Kenya was purposively selected due to its large and rising TB burden (ranked 13th among the 22 high burden countries) that collectively contribute about 80% of the world´s TB cases. Random sampling method was used to select hospitals. Health centers were also randomly selected. Dispensaries were categorized into three according to the number of patients (beyond 400 patients, between 200-400 patients and below 200 patients). A simple random sampling method was used to select study sites from each category. To recruit the TB patients from the selected study sites, probability proportional to size was used. TB patients selected for the study sample were then randomized into experimental and control groups.
Sample size determination: sample size was determined by using the Lemeshow & Hosmer (1990).
Design effect was assumed at 1.5. The sample size was then: 137 x 1.5 = 205 10% (25) of the sample was added to take care of mortality, transfers and possible withdrawals. Total sample size (225) for each group. Total sample size for the two groups (450). Interventional group (225) and control group (225). From the targeted sample size of 450 patients, 225 were allotted to the experimental group and 225 to the control group. The study adopted the multi-stage sampling. Random sampling was used to select the hospitals, health centers and dispensaries (2 hospitals, 5 health centers and 7 dispensaries. Random sampling proportionate to TB patients´ population was adopted in selecting the study patients.
Patients´ recruitment: tuberculosis patients were recruited from the selected health facilities with the help of the clinical staff in those facilities. The patient was identified through the attendance and treatment registers. The potential participants were then provided with detailed explanation about the study objectives. After assurance of confidentiality, those willing to participate in the study were asked to sign the informed consent form.
Data collection: a standard questionnaire was used to collect data from patients. To capture the patient´s case management details, a structured hospital data treatment form was developed. The key parameters for this review included: name of health facility, TB case, date registered, age, sex, residence, TB supporter, and contact details of the patient. The questionnaire was used to collect data on the social-demographic characteristics of the patients as well as details pertaining to the costs incurred by patients both at the pre- and post-phases. Information for the patient´s and household´s costs incurred during treatment was collected using TB patient´s illness history and questions on household´s costs in the questionnaire, where patients were required to indicate the costs they had incurred in the course of treatment. The fourteen selected health facilities were visited for the recruitment of the TB patients who were studied. In each of these facilities, the TB patients were identified through the TB attendance and treatment registers. To ensure that patients started and ended the health program intervention at the same time, the researcher recruited those TB patients who had been on treatment for at least two weeks. Patients´ recruitment was facilitated by the clinical staff in the study sites. During recruitment, potential participants were provided with detailed explanations about the study objectives. To capture the TB patient case management details, a structured hospital data treatment form was developed. The key parameters for this review included; name of the study site, TB case, date registered, age, sex, residence, TB supporter, and contact details of the patient.
Ethical considerations: permission was sought and received from Kenyatta National Hospital (ref: KNH-EBC/RR/421), University of Nairobi Ethics Review Committee, Nairobi City County (ref: CMO/NRB/OPR/VOL 1-2/2019/114) and National Commission for Science, Technology and Innovation (NACOSTI) (ref: NACOSTI/P/19/72250/31745). The participant´s consent was voluntary, free of any coercion, intimidation or inflated promise of benefits from participation. Care was taken to ensure that the consent form was administered by someone who did not hold authority over the participant. Anonymity, confidentiality, secrecy and privacy were safeguarded with regard to information about treatment, medical records and drugs for the patient.
The health education intervention program (precede-proceed) model: the precede-proceed model was used to implement the health education (Annex 1). This model of planning health education program had been successfully implemented in Thailand to improve TB Migrants compliance to treatment (Pornsak, 2016) [7]. The various health education activities that were carried out coincided with the time the patient was seeking treatment. Only patients in the experimental group received the health education. The health education interaction was twice a month and took (10-15) minutes on average for the next 6+ months. The health education technique used was in the form of teaching, questions and answers, interview, discussion and scenario analysis. Education materials consisted of interactive tools including pictures and cards with topics for discussion on basic issues about tuberculosis. The components of the health education provided essential facts about the disease, diagnosis and treatment, potential barriers to treatment adherence, possible adverse effects of the medication, provision of support through counseling and encouragement of social support from family and friends.
Statistical methods: both descriptive and inferential statistics were used in analyzing data. SPSS v.20 and Excel were used to conduct the analysis. Patient´s social/demographic characteristics were summarized using descriptive statistics and presented in tables showing frequencies and percentages. Household income was classified using the Kenya National Bureau of Statistics final economic survey report of 2019 [8]. In the report, majority of people in Kenya earned between KES 10,000-30,000 (USD 100-300) and classified those earning below KES 10,000 (USD 100) as least income earners/ poor. To calculate costs, the patients provided information on consultation fees, diagnostic fees and travel, lunch and accommodation expenses they had incurred while seeking care and productive hours lost due to sickness. With this information, costs were further categorized as either direct or indirect costs as suggested in the first Kenya TB patient cost survey report. Total costs were the sum of direct and indirect costs in the pre-test and post-test phases. Since patients were recruited from the TBN register having attended TB treatment for two weeks, there were costs at the pre-test phase. Statistical significance was evaluated at p<0.05.
Though 450 patients were identified and recruited for the study, only 373 were included in the study. The remaining 77 did not meet the eligibility criteria due to being underage, having MDR-TB and HIV. Of the 373 patients, 186 were in the experimental group and 187 were in the control group, both at the beginning and at the end. None of the patients in the baseline dropped out of the study. All the patients under review received standard treatment.
Demographic characteristics of patients: most (63%) of the respondents were male, while 37% were female. Most of the respondents (17.4%) were aged between 25-29 years, followed by 15.6% of respondents aged 30-34 years. Those with primary and secondary school levels of education were 32.5% and 41.8%. Most of the respondents were household heads (61.7%) and were married (55.5%). The findings also indicate that the majority of the respondents were employed in the informal sector (33.8%) or unemployed (30%). Statistical comparison between the experimental and control groups for each of the socio-demographic characteristics showed no differences between the groups, as indicated by the p-values on the table (Table 1).
Costs for tuberculosis treatment and household income: costs associated with TB treatment are classified as direct medical costs (consultation fees, diagnostic tests etc.), direct nonmedical costs (travel, accommodation while seeking care) and indirect costs (productivity hours´ loss). The household income was categorized into two brackets: poor (below KES 10,000) and least poor (KES 10,000). Most respondents were least poor in both the experimental (65.1%) and control (56.1%) groups (Table 2). Both monthly and household income loss was recorded for both groups in the post-test phase. In the experimental group, there was an average monthly income loss of KES 3.682.80 (USD 36.83) in KES 3,892.21 (USD 38.92) in the control group; similarly, there was an average household income loss of KES 2,807.23 (USD 28.07) in the experimental group and KES 3,947.59 (USD 39.48) in the control group.
Patients were classified as poor and least poor based on Kenya National Bureau of Statistics (KNBS) data from 2019. Those earning below KES 10,000 were in the poor category, while those earning an amount equal to or more than KES 10,000 were in the least poor category. There was a 16.1% increase in patients who joined the poor category in the pre-test phase in both the experimental and control groups based on monthly income losses. There was a mean monthly income loss of USD 36.83 (26.4%) in the experimental group and USD 38.92 (30.7%) in the control group; similarly, there was an average household income loss of USD 28.07 (17.5%) in the experimental group and USD 39.48 (27.8%) in the control group. This is in agreement with the findings by Onazi et al. (2015) [9] which found that TB treatment caused about 24% income loss in households.
Before TB, poor patients were 34.9% in the experimental group and 43.9% in the control group but with TB, poor patients increased to 43.4% (8.5% increase) in the experimental group and 63.6% (19.7% increase) in the control group. This is in agreement with the study carried out by Kingsley et al. (2012) [10] who found that after diagnosis of TB poor patients increased from 54% to 79%. In the experimental group, total costs were 54.03% of household income in the pre-test phase and 43.08% in the post-test phase, indicating a 10.95% decrease while in the control group, total costs were 63.63% in the pre-test phase and 60.14% in the post-test phase which indicated a 3.22% decrease in total costs. This demonstrated that the experimental group had more cost savings. Overall, in the experimental group, total treatment costs were 21.54% of annual household income while in the control group, total treatment costs were 30.07% of annual household income. This is in agreement with the study conducted by Ukwaja et al. (2016) [11] which found that total TB treatment ranged from 0.2%-30% of annual household income.
In the pre-test phase, the total treatment costs were similar for both the experimental (USD 16,071) and control (USD 16,543.30) groups but in the post-test phase, the control group (USD 67,570) had higher costs than the experimental group (USD 59,073) indicating the experimental group had more cost savings than the control. The control group patients incurred 8,497 USD more than the experimental group patients. In the pre-test phase, each patient incurred an average of 86.40 USD in the experimental group and 88.47 USD in the control group. In the post test phase, each patient incurred an average of 317.60 USD in the experimental group and 361.34 USD in the control group. Many other similar findings, notably Ukwaja et al. (2016) [11] and Laurence et al. (2015) [12] established total treatment costs for a TB patient for the entire period of treatment as ranging between USD 55-772.
Tuberculosis treatment and catastrophic costs: treatment costs were catastrophic if they were equal to or more than 10% of annual household income. In the pre-test phase, there were 61.8% of patients in the experimental group with catastrophic costs and 63.6% of patients in the control group with catastrophic costs. In the post-test phase, patients with catastrophic costs were 76.9% in the experimental group (15.1% increase, p=0.003) and 94.7% in the control group (31.1% increase, p=0.000). There was more increase in patients with catastrophic costs in the control group in the post-test phase (Table 2).
Total treatment costs as a percentage of household income: in the experimental group, total costs were 54.03% of household income in the pre-test phase and 43.08% in the post-test phase; this indicated a 10.95% decrease, indicating that the patients spend less than time went by. In the control group, total costs were 63.63% in the pre-test phase and 60.14% in the post-test phase, which indicated a 3.22% decrease in total costs. There were more percentage cost savings in the experimental group. Overall, in the experimental group, total treatment costs were 21.54% of annual household income while in the control group, total treatment costs were 30.07% of annual household´ income.
Days lost due to patient´s illness: the number of days lost due to illness was calculated. This was the number of work days lost due to illness and the number of visits to the TB clinic. The days lost due to illness were used to calculate lost income of the patients, and they contributed to household income loss. The mean for the days lost due to the number of visits to facilities and work days lost were calculated for both the pre-test and post-test phase, as well as the resulting mean changes. The experimental group had fewer visits to TB clinics (mean change=10.32, p=0.000) than the control group (mean change=12.3, p=0.000). Similarly, the experimental group lost less work days (mean change=14.19, p=0.000) than the control group (mean change=17.23, p=0.000) indicating that the health education program had an effect on the number of days lost due to illness (Table 3).
Treatment costs incurred by TB patients: the treatment costs incurred by the patients were divided into direct and indirect costs. The direct treatment costs were the cost of each visit/diagnostic costs (consultation fees, transport costs and medication costs) and post-diagnostic costs such as follow-up costs. Indirect costs were the costs incurred by the TB supporter (transport, lost income, food); the patient´s lost income and coping costs (interest rates on borrowing and sold assets). In the pre-test phase, the total costs were roughly similar for both the experimental (USD 16,071) and control (USD 16,543.30) groups but in the post-test phase, the control group (USD 67,570) had higher costs than the experimental group (USD 59,073) (Table 4). The difference observed in treatment costs at the posttest phase was significant (p=0.001).
Cost of tuberculosis treatment and household income: this study determined that before tuberculosis infection, the category of the patients considered poor were 34.9% in the experimental group and 43.9% in the control group. After infection, poor patients increased to 43.4% (8.5% increase) in the experimental group and to 63.6% (19.7% increase) in the control group. As is already known, tuberculosis patients as well as their households to cost burden arising from the expenditure associated with the health care. The findings were in agreement with the study carried out by Kingsley et al. (2012) [10] who found that after diagnosis of tuberculosis poor patients increased from 54% to 79%. In the experimental group, total costs as a percentage of household income decreased by 10.95% while in the control group there was a 3.22% decrease. This indicated that the experimental group had more cost savings. Overall, in the experimental group, total treatment costs were 21.54% of annual household income while in the control group, total treatment costs were 30.07% of annual household income. This supports the position that tuberculosis infection not only affects the patient´s income but the household too. This is also supported by Ukwaja et al. (2016) [11] where his study found that total TB treatment costs ranged from 0.2%-30% of annual household income. The study established that in the pre-test phase, the total treatment costs were similar for both the experimental (USD 16,071) and control (USD 16,543.30) groups. In the post-test phase, the control group (USD 67,570) had higher costs than the experimental group (USD 59,073) indicating the experimental group had more cost savings than the control. Notably, the costs were within the range observed in similar studies (Ukwaja et al. 2016) [11] and Laurence et al. (2015) [12] where total costs for a TB patient for the entire period of treatment were USD 55-772). The experimental group had more cost savings than the control group. The control group incurred 8,497 USD more than the experimental group. This may have been made possible due to the fat that patients who had been subjected to the intervention had utilized information and knowledge from health education to reduce expenditure related to the various costs in tuberculosis treatment.
Days lost due to tuberculosis patient´s illness: the number of days lost due to illness was calculated. This was the number of work days lost due to illness and the number of visits to the TB clinic. The days lost due to illness were used to calculate lost income of the patients, and they contributed to household income loss. In the experimental group, the pre-test means for work days lost was 6.17 days and the mean was 20.36 days in the post-test phase (difference=14.19). In the control group, the posttest means for work days lost was 6 days in the posttest phase and 23.23 in the posttest phase (difference=17.23) indicating that the patients in the control group lost more work days than those in the experimental group. This could have resulted from the increased adherence to treatment by patients in the experimental group as a result of health education compared to the control group which did not receive the intervention. These findings support the study by Julia et al. (2020) [13] who reported that TB patients who were fully treated lost less work days (average 2 weeks) than those who were left untreated (8-12 weeks).
Socio-demographic factors as indicators of catastrophic treatment cost: treatment costs were categorized as catastrophic if they were equal to or more than 10% of annual household income. Age, gender, marital status, education and occupation were associated with costs to determine if they were indicators for catastrophic treatment cost.
Primary occupation as an indicator for catastrophic treatment costs: in the experimental group in the pre-test phase occupation was not associated with catastrophic treatment costs, however in the post-test phase, primary occupation specifically agriculture (OR 7.437; 95% CI [1.818-30.424], p=0.005), formal sector (OR 4.852; 95% CI [1.127-20.881], p=0.034) and informal sector (OR 5.066; 95% CI [1.569-16.356], p=0.007) occupations were associated with catastrophic treatment costs. Agriculture (OR 0.112; 95% CI [0.012-1.049], p=0.05) was associated with catastrophic treatment costs in the post-test phase in the control group. Patients who were working in agriculture sector likely faced more catastrophic treatment costs because their livelihood is dependent on their activity in the farms. With many work days lost visiting facilities, it is likely that they lost income and thus had more catastrophic treatment costs. The same is true for those working in the informal sector. Formal sector employees may also have lost some of their income due to company policies. Many studies researching on TB treatment and associated catastrophic costs (Prassana et al. (2018) [14] and Liping Lu et al. (2018) [15] determined that the occupation of the TB patient undergoing treatment in the health care facility was an important factor in regard to costs of treatment of TB. Patients in the informal sector appears to encounter catastrophic costs more than formal sector workers.
Level of education as an indicator for catastrophic treatment costs: in the control group, primary school level education (OR 0.251; 95% CI [0.085-0.738], p=0.012) was associated with catastrophic treatment costs in the pre-test phase, but it was not an indicator in the post-test phase. Primary level of education is associated with informal work, which would have been more affected by loss of income due to lost days of work. This may be the reason why primary level of education was associated with catastrophic treatment costs. The findings of this study confirmed research conducted in China by Liping Lu et al. (2018) [15] on catastrophic costs of TB care in a population with internal migrants, which observed that patients with low level of education were more likely to experience catastrophic costs than those with higher levels of education.
Strengths and weaknesses of the study: the study had both experimental and control groups, which allowed for comparison after the intervention was applied. Thus, the results clearly showed the differences between the groups as a result of the health education intervention.
Strengths and weaknesses in relation to other studies: the study findings were similar to those in the study conducted by Barter D (2015) [16] which found that total TB treatment ranged from 0.2%-30% of annual household income. In the experimental group, overall treatment costs were 21.54% of annual household income, while in the control group they were 30.07% of annual household income. Further, the study found that after diagnosis of TB, poor patients increased from 54% to 79%. In the present study, poor patients increased in both the experimental (8.5% increase) and control (19.7% increase) groups.
Meaning of the study: according to Kenya National Tuberculosis Survey report of 2016, ignorance about TB is the reason for the continuing increase in the TB cases and the associated cost burden in the country. This study has determined that with a structured health education program given to the patient for the whole period of treatment (six months) may help the patient reduce expenditure while seeking TB care. With the reduced expenditure, the cost burden at patient and household level will be mitigated. From the results already discussed above, health education intervention was found to have an effect on patient´s treatment and household costs. Patients in the experimental group had better household´s overall cost savings as compared to the patients in the control group.
Unanswered questions and future research: at the beginning of the study, the researcher was aware that the clinical staff were expected to offer health education to patients when they visited TB clinics for treatment. In the whole period of the study, no structured health education was witnessed being given to the patients. This study adopted the comprehensive health education package (PRECEDE-PROEED) model with expected outcomes, which was not what the clinical staff were delivering. The unanswered question however is whether the results would have been the same had the health education program been delivered by the clinical staff themselves. This may require further enquiry. Meanwhile, further research is needed to determine to what extent disparities in treatment costs among TB patients affect treatment outcomes.
Assumptions, limitations and generalization of the study: the study assumed that all TB cases which were recorded in the counties public health facilities and who participated in the study gave the correct information about their social/demographic characteristics, treatment and treatment outcomes. It was also assumed that the patients followed the health education objectively and honestly. However, there were the possibilities of having obtained less accurate information or biases due to the health state of the patient. Awareness creation and randomization at cluster level ensured bias was minimized. To build confidence and for better health education uptake, the researcher worked closely with the TB clinic managers and the community health volunteers in the respective health facilities. This was a randomized controlled trial design study which ensures bias is minimized, hence allowing generalization. The review study was conducted in outpatient TB clinics, which were similar to the target setting. Public health facilities in Kenya attend to patients of similar characteristics, thus the participants of the review studies were also comparable to the target audience in terms of sex, ethnicity, diagnosis and treatment of the disease. Therefore, the similarity in setting and target populations in both the review studies and this study meant that findings could be generalized.
Patients in the experimental group incurred fewer costs as compared to the patients in the control group after the health education intervention. The experimental group also had less fixed costs in the post-test phase compared to the control group. The control group incurred KES 8,931.83 (USD 89.32) higher fixed costs than those of the experimental group.
What is known about this topic
- The costs for hospitalization, medication, transportation, and care in the private sector are usually the highest costs incurred by patients;
- Overall, 32.4% of households experienced catastrophic costs to TB care;
- Mean patient pre-diagnosis costs vary between USD 36 and USD 196, corresponding to 10.4% and 35% respectively of their annual income.
What this study adds
- Health education helps patients reduce their treatment costs by helping them reduce their fixed costs;
- Health education also reduces the number of patients who end up with catastrophic treatment costs as treatment progresses;
- Health education helps patients have less household income loss as a result of treatment and lost working days.
The authors declare no competing interests.
All authors were involved in drafting of the manuscript. They also read and approved the final manuscript.
We thank Ronnie Midigo and Winnie Nyokabi for assisting in technical and editing aspects of the study. We are further grateful to all TB coordinators and health care workers in all the selected TB centres in Nairobi and Murang�a counties who made patient�s respondent identification and data collection possible. We are also grateful to our colleagues in the Faculty of Applied Sciences and Technology, Technical University of Kenya for their encouragement and support.
Table 1: demographic characteristics of patients
Table 2: household income changes, catastrophic costs and treatment costs as a percentage of household income
Table 3: days lost due to illness
Table 4: treatment costs incurred by TB patients
Figure 1: CONSORT flow diagram
Annex 1: health education (precede-proceed) model (PDF-338Kb)
- World Health Organization. Global strategy and targets for tuberculosis prevention, care and control after 2015: Report by the Secretariat. 2015. Accessed Dec 22, 2021.
- World Health Organization. Global Tuberculosis report, 2015, 20th edition, World Health Organization. 2015. Accessed Dec 22, 2021.
- World Health Organisation. Global tuberculosis. 2017.
- Ministry of Health. The first Kenya TB patient cost survey. National Tuberculosis and lung disease program, Kenya. 2017. Accessed Dec 22, 2021.
- National Tuberculosis Program. The first Kenya TB patient cost survey. Ministry of Health, Kenya. 2016.
- Roland D, Joris V, Gerand DV, Albert N. Costs of tuberculosis disease in the European Union; a systematic analysis and cost calculation. Eur Respir J. 2014 feb;43(2):554-65. PubMed | Google Scholar
- PornSak K. Health education program for improving TB Migrants compliance to treatment. Mohidok University, Bangkok, Thailand. 2016.
- Kenya National Bureau of Statistics. Economic survey report. Kenya National Bureau of Statistics, Nairobi, Kenya. 2019.
- Onazi O Gidado M, Daniel O Kuyej, Obasanyo O Odusote T, Gande S. Estimating the cost of TB and its social impact on TB patients and their households. 2015. Google Scholar
- Kingley N, Modebe C, Igwenyi and Isaac A. The economic burden of TB care for patients and households in Africa; a systematic review. The international journal of TB and Lung diseases. 2012;16(6);733-745. PubMed | Google Scholar
- Ukwaja K, Isaac A, Chika I, Philip CH. The high cost of free TB services: patient and household costs associated with TB care in Ebonyi State, Nigeria. University of Otago, New Zealand. 2016. Google Scholar
- Laurence Y, Ulla K Griffiths, Vassall A. Costs to health services and patient of treating TB: a systematic literature review. Journal of Tuberculosis. 2015;33(9):939-55. PubMed | Google Scholar
- Julia RK, Gillian M, Bertha NS, Felix ML S, Stephen BS. Can Malawi poor afford free TB services? Patient and household costs associated with a TB diagnosis in Lilongwe, Malawi. Bulletin of the World Health Organization. 2020. Google Scholar
- Thirunavukkarasus P, Kathiresan J, Palanivel CB, Kaita V, Mrinalini D. Catastrophic costs of TB care; a mixed methods study from Puducherry, India. Global health. 2018. Google Scholar
- Liping L, Qijing J, Jiangu Hg, Xiaoping J, Qian Gao Heejung B et al. Catastrophic costs of TB care in a population with internal migrants in China. Guangzhou, China. BMC health. 2018. Google Scholar
- Barter D. The contribution of patient costs in sub-Saharan Africa. a systematic review MBC public health. 2015;12.
Search

This article authors
On Pubmed
On Google Scholar
Citation [Download]
Navigate this article
Similar articles in
Key words
Tables and figures
Article metrics
Recently from the PAMJ-OH