
Progress of water, sanitation, and hygiene facilities in public primary schools of south Gondar zone, Northern Ethiopia
Alebachew Amsalu, Getaneh Atikilt, Wubet Taklual, Anemut Tilahun
Corresponding author: Alebachew Amsalu, Department of Environmental Health Science, College of Health Sciences, Debre Tabor University, Debre Tabor, Ethiopia 
Received: 21 Jul 2021 - Accepted: 06 Nov 2021 - Published: 22 Feb 2022
Domain: Environmental health, Environmental management, Food protection
Keywords: Primary school, public, rural, urban, water, sanitation, hygiene
©Alebachew Amsalu et al. PAMJ-One Health (ISSN: 2707-2800). This is an Open Access article distributed under the terms of the Creative Commons Attribution International 4.0 License (https://creativecommons.org/licenses/by/4.0/), which permits unrestricted use, distribution, and reproduction in any medium, provided the original work is properly cited.
Cite this article: Alebachew Amsalu et al. Progress of water, sanitation, and hygiene facilities in public primary schools of south Gondar zone, Northern Ethiopia. PAMJ-One Health. 2022;7:19. [doi: 10.11604/pamj-oh.2022.7.19.30874]
Available online at: https://www.one-health.panafrican-med-journal.com/content/article/7/19/full
Research 
Progress of water, sanitation, and hygiene facilities in public primary schools of south Gondar zone, Northern Ethiopia
Progress of water, sanitation, and hygiene facilities in public primary schools of south Gondar zone, Northern Ethiopia
![]() Alebachew Amsalu1,&,
Alebachew Amsalu1,&, ![]() Getaneh Atikilt2, Wubet Taklual2,
Getaneh Atikilt2, Wubet Taklual2, ![]() Anemut Tilahun3
Anemut Tilahun3
&Corresponding author
Introduction: school water, sanitation and hygiene initiatives are the first steps towards improving health, education outcomes, and gender parity. Sustainable development goals (goal 6: “water and sanitation for all by 2030”) and specifically goals 6.1 and 6.2 focus on drinking water, sanitation, and hygiene. This study evaluated the progress of the water, sanitation and hygiene facilities in public primary schools.
Methods: a school-based cross-sectional survey was used, and primary data were collected by questionnaires through a face-to-face interview with school principals. Data input and cleanup were performed using EPI INFO (version 3.1), and statistical analyzes were performed using SPSS (version 23). Dependent variables were measured according to the indicators of the sustainable development goals such as basic, limited, and no services. The Chi-squared test was used to investigate the relationship of categorical outcome variables and a P-value of < 0.05 was considered significant and a 95% confidence interval was considered.
Results: urban (68.8%) and rural (51.4%) public primary schools had access to drinking water through basic services, while 26% of rural public primary schools do not have drinking water sources. Regarding the ladder of services for sanitation in public primary schools, urban (66.7%) and rural (42.3%) had access to basic sanitation services, and 57.7% of rural public primary schools do not have sanitation services. The handwashing facilities in these schools were very low in both urban (35.4%) and rural (3.6%). Only urban public primary schools (8.3%) provide soap and water at handwashing stations. The solid waste disposal methods in public primary school methods consists mainly of burning (71.3%), followed by disposal (25%).
Conclusion: the public primary schools were far from the way to achieve the sustainable development goals. Half of rural public primary school (PPSs) had limited or no services. More than half of rural were accessed with no sanitation services. The proportion of handwashing facilities in public primary schools was very low. Even though there were better water, sanitation, and hygiene facilities among urban public primary schools compared with rural, strong emphasis should be given for both school managements in the remaining time.

School water, sanitation and hygiene (WaSH) is the first step that refers to the combination of technical and human development components which are indispensable for effective learning, enrollment and retention of girls, reduction of diseases and worm infestation, environmental cleanliness, cleanliness, and implementation of child rights [1]. Sustainable development goals (SDGs) of the goal: 6 “water and sanitation for all by 2030” and specifically SDGs 6.1 and 6.2 focus on drinking water, sanitation and hygiene [2]. It is well known that improving WaSH is essential for reducing infant mortality and improving health in a sustainable manner. However, 2.5 billion, 748 million, and 1 billion people lack improved sanitation facilities, improved drinking water sources, and practice open defecation, respectively [3].
Each year 1.7 billion under five diarrheal case, 3 million cholera cases, and 11 million typhoid cases reported [4]. From 1.4 million diarrheal deaths, 485,000, 432,000, and 165,000 were attributable to inadequate water, sanitation, and hygiene, respectively [5]. In Ethiopia, school-aged children lack the habit of handwashing after using the toilet, which is the leading cause of intestinal parasitic infection [6], with prevalence ranging from 16% in Dessie [7] to 66.7% in Jimma [8]. The majority of Ethiopian primary schools have sanitation facilities, with 86% having at least one latrine. The majority, however, are traditional pit latrines, and only 31% of school latrines are classified as “improved sanitation” [9]. Data on WaSH progress should be disaggregated, equitable, and of high quality for national and international comparable [10]. Sustainable development goals indicators (SDGIs) were developed to track WaSH progress in schools as advanced, basic, limited, and no services [11]. This study investigated the progress of WaSH facilities in public primary schools (PPSs) based on SDGI (defined and consistent indicators established by JMP), which can be considered as an input for the implementation of the SDGs.

Study area: the South Gondar zone is located in the Amhara region, northern Ethiopia, approximately 666 km from the capital of Ethiopia, Addis Ababa. South Gondar zone has a total population of 2,239,077 (2017 estimation) with an area of 14,095.19 km2. South Gondar zone has 13 districts and two town administrations (Debre Tabor and Woreta) and a total of 401 kebeles.
Study design: south Gondar Zone as a study area are because of study feasibility and a baseline to show international based indicator assessment of WaSH facilities coverage in PPSs. Public primary schools in the southern Gondar zone were surveyed using a school-based cross-sectional survey. The research was carried out during October and November 2020. All PPSs found in the south Gondar zone in the 2020 academic year were the source population. Urban and rural PPSs were considered a study unit. In this study all urban PPSs (48) found in the South Gondar zone and all rural PPSs (113) found in Farta Woreda were included.
Data collection methods: data were collected by questionnaires and observational checklist. The data collection tools used to collect data were containing sections of school characteristics, water supply, sanitation, and hygiene assessment. The questionnaire and the checklist were prepared based on SDGI and definitions from previous tools [11]. The English version of the data collection tool was translated into the local language (Amharic) and back to English, and consistency was checked. Data collectors and supervisors were selected based on WaSH and survey experience. Public health professionals and health extension workers were participated in data collection after two days of training. Data were collected from the head of the school and their delegates in the absences of school heads and returned to each school up to three times to ensure the highest possible response rate.
Public primary school: includes the first primary cycle (1-4 grades) and the second primary cycle (5-8 grades) [9]. Improved water sources: piped water, boreholes, protected well, or spring rainwater [11]. Unimproved water source: water from a tanker, surface water, unprotected well, or spring [11]. Measurement of the outcome variables (WaSH): the progress of water, sanitation and hygiene was measured based on SDGI described by [11] and reported as basic, limited and no services for each outcome variable (Table 1) [12].
Data quality control: a pretest was conducted among the PPSs not included in the study to ensure the completeness and internal consistency of the questionnaire and checklist. Based on this, the questionnaire and checklist was refined to take into account the regional context. Data were cleared by identifying those who had incomplete responses and no responses and categorizing, editing, coding, classifying and tabulation of the collected data. Data quality was checked in the field to ensure that all data were collected and recorded, and was checked centrally in the office after the fieldwork was completed and returned.
Data processing and analysis: data entry, cleaning, and verification were performed using EPI INFO (version 3.1). Statistical analyzes were calculated based on excel and SPSS (version 23). The data were summarized and presented using tables and figures in addition to narration. A P-value of (p<0.05) was considered significant and a 95% confidence interval was considered.
General characteristics: the survey was completed and returned by 159 (48 urban and 111 rural) PPSs (response rate 98.8%). There were 19,694 (boys), 22,815 (girls) and 176 (special need) students in urban PPSs. In rural PPSs, 36,673 (boys), 43,632 (girls) and 36 (special needs) students attended their education in Farta Woreda, South Gondar zone.
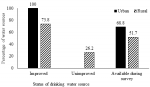
Water sources in public primary schools: both urban (100%) and rural (73.4%) PPSs participated in this study were accessed their drinking water from improved sources (Figure 1). Based on drinking water service ladders, 68.6% of urban and 26% of rural PPSs have access to basic services and no services, respectively (Figure 2). Pipe water was the main drinking water source for urban (87.5%) and rural (41.4%) PPSs. In this study, (3.6%) and 10.8% of rural PPSs had access to their main drinking water from surface water sources and without available drinking water sources in the school, respectively (Table 2). This difference was statistically significant at the 5% level (p<0.001). The proportion of PPSs with improved drinking water sources was higher in urban areas than in rural areas, 100% compared to 75.7%. This difference was statistically significant at the 5% level (p<0.001). In this study, 10.4% (urban) and 27% (rural) PPSs were accessed for drinking water sources available throughout the year and there was no drinking water source available throughout the year in 17.1% (rural) PPSs (Table 3). This difference was statistically significant at the 5% level (p=0.025). Only 18.8% (urban) and 5.4% (rural) drinking water sources were comfortable for small children and special need students.
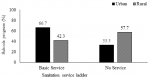
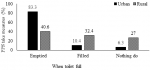
Sanitation facilities in public primary schools: Urban (66.7%) and rural (42.3%) PPSs were accessed for improved sanitation sources. According to the sanitation ladders, 57.7% of rural PPSs do not have sanitation services (Table 4). The percentage of PPSs with improved toilet facilities were higher in urban than those in rural, 67% as compared to 42.3%. This difference was statistically significant at the 5% level (p<0.001). In the overall sanitation service ladders, 49.7% (66.7% urban and 42.3% rural) PPSs had basic sanitation services (Figure 3). There was no single toilet facility for small children in rural PPSs, whereas 16.7% of urban PPSs had at least one toilet for small children´s students (Table 5). This difference was statistically significant at the 5% level (p<0.001). Urban (83.3%) and rural (40.6%) PPSs emptied the toilet when full (Figure 4).
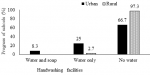
Hygiene facilities in public primary schools: the handwashing facilities in PPSs were very low in rural areas (3.6%) compared to urban areas (35.4%) (Figure 5). Handwashing facilities (12.5%) urban and (0.9%) rural PPSs had comfortable handwashing facilities for small children and special-need students. The common type of effort made for Menstrual Hygiene Management (MHM) among PPSs was providing health education on MHM (79.2%) urban and (72%) rural and 28% (rural PPSs) did not perform any activities related to MHM (Table 6). Solid waste management system of urban 41 (85.4%) and rural 73 (65.8%) PPSs were mainly based on burning in the school compound (Table 7).
Ethical considerations: initially, letter of approval was obtained from Debre Tabor university research and ethics review committee. Permission from South Gondar zone education office also was to be obtained.
Access to better drinking water sources in schools is an opportunity to improve health and education. In general, 56.6% (68.8% urban and 51.2% rural) PPSs accessed drinking water from basic services. Generally, 83% of PPSs had drinking water from improved sources (100% urban and 73.4%) rural). Based on measures of sanitation ladders, 66.7% (urban) and 57.7% (rural) PPSs were served from basic sanitation services and do not have sanitation services, respectively. Urban PPSs with basic hygiene services (handwashing facilities with water and soap) were only 8.4% and rural PPSs (96.4%) was with no handwashing services (with only water and/or no handwashing facilities).
Drinking water sources from improved sources have an essential role in reducing communicable diseases. In this study, 83% of PPSs obtained drinking water from improved sources, which is in line with the global baseline report [13], and higher than 68% of the schools have an improved source of drinking water [14] and much higher than study in Uganda as government primary school only 14% [15], got their drinking water from piped water sources and this variation might be due to study setting. Drinking water from improved sources is not evidence of drinking water accessibility and should be available at all times. Based on drinking water service ladders, in this study about 57% of PPSs accessed from basic drinking water sources, which was lower than 69% [13] and much higher than 7% of the study [16]. All urban PPSs assessed drinking water from protected sources of which 69% of urban primary schools accessed water at the time of visit, which is better than 56% of Mozambique and 10% of Ethiopia [17] and the study [18] that 40% of primary school got from piped water sources. In this study, rural PPSs (51%) had access to drinking water from basic services, which is much higher than the study [19] that 4% of rural schools in low and middle income countries had basic water sources. In the current study, 14.4% of rural PPSs do not have drinking water sources and is lower than 24% of the study [19].
Water sources should consider students with special needs and small children. In this study, 9% of the PPSs water sources were comfortable for special-need students and small children, and this is very far from the study [20] that the majority of the schools (74%) had no facilities accessible to students with physical disabilities. In this study, half (49%) of the PPSs were accessed for improved toilet facilities, which is very far lower than 90% of the toilets were improved latrines [20]. This study showed that 54.5% of PPSs accessed from basic sanitary service and 67% of urban PPSs had access to basic sanitation, which is lower than the global reports of 63% and 90%, respectively [21]. Hand hygiene is the most important practice to limit the transmission of diseases. The prevalence of handwashing facilities in the current study was very low with 13%, and only 3%of basic hygiene services, which is lower than 56% of primary schools had a basic hygiene service [21]. In this study, all rural PPSs had no hygiene services and were far from the report, with 41% of rural primary schools without hygiene services. Solid waste disposal options in this study showed that most of the urban and rural schools were practicing open burning.
Limitations of the study: current water quality data would have offered further insight into the water quality utilized in the investigated schools, but they were unavailable. The authors, on the other hand, follow the Joint Monitoring Programme (JMP) indicators and operational definitions.
In this study, it is possible to conclude that PPSs were far from the way to achieve SDGs. Regarding drinking water sources, half of rural PPSs were under limited service and had no services. More than half of rural PPSs were accessed with no sanitation services. The proportion of handwashing facilities in PPSs was very low. Even though there were better water, sanitation, and hygiene facilities among urban PPSs compared with rural, strong emphasis should be given for both school managements in the remaining time. Immediate opportunities to increase equitable access to WaSH in schools in these settings include improved WaSH construction facilities, ready for users and providing soap, water, and drying materials in handwashing facilities during school days. These changes highlight opportunities for health officials, practitioners, and school administrators to improve WaSH services in study regions, improve health, access to education, and gender parity among students.
Funding: this study did not receive particular support from government, commercial, or non-profit funding organizations.
What is known about this topic
- Coverage of WaSH in schools using traditional tools;
- School WaSH coverage at national level still based on inconsistent indicators.
What this study adds
- Progress of WaSH facilities in public urban and rural primary schools independently;
- Investigation was done based on international school WaSH indicators;
- Baseline for the study region (new for the study region).
The authors declare no competing interests.
AA wrote the manuscript, including tables and figures. GA, WT and AT. have contributed to methods section. All the authors have read and agreed to the final manuscript.
The authors would like to acknowledge south Gondar zone education office for their permission and school supervisors. The authors also express their gratitude to data collectors, supervisors, and school principals in the south Gondar zone.
Table 1: SDGI used to measure the progress of WaSH, the South Gondar zone, 2020
Table 2: main drinking water source of the school by location, South Gondar zone, Northern Ethiopia, 2020, 2020 (N=159)
Table 3: proportion of PPSs with drinking water sources availability, South Gondar zone, Northern Ethiopia, 2020, 2020 (N=159)
Table 4: proportion of PPSs by types of toilet facilities in relation to school location, South Gondar Zone, Northern Ethiopia, 2020 (N=159)
Table 5: proportion of PPSs toilets by school location, south Gondar zone, northern Ethiopia, 2020
Table 6: the PPSs effort done for MHM, South Gondar zone, Northern Ethiopia, 2020
Table 7: solid waste management in PPSs by school location, southern Gondar zone, northern Ethiopia, 2020 (n=159)
Figure 1: proportion of PPSs water source options, south Gondar zone, Northern Ethiopia, 2020
Figure 2: proportion of the water service ladder of PPSs, south Gondar zone, northern Ethiopia, 2020
Figure 3: proportion of PPSs with toilet facility status, South Gondar Zone, Northern Ethiopia, 2020
Figure 4: proportion of PPSs measures taken when the toilet is full, South Gondar zone, Northern Ethiopia, 2020
Figure 5: proportion of PPSs handwashing facilities, South Gondar Zone, Northern Ethiopia, 2020
- Mooijman A, Snel M, Ganguly S, Shordt K. A WaSH guidance manual with a focus on South Asia. IRC technical paper. 2010.
- UNDP. Sustainable development goals booklet. 2015. Accessed on Feb 21, 2022.
- World Health Organization. World health statistics 2019: monitoring health for the SDGs, sustainable development goals. Geneva: World Health Organization; 2019. Accessed on Feb 21, 2022.
- CDC. Disease threats and global WASH Killers. Accessed on Feb 21, 2022.
- Prüss-Ustün A, Wolf J, Bartram J, Clasen T, Cumming O, Freeman MC et al. Burden of disease from inadequate water, sanitation and hygiene for selected adverse health outcomes: an updated analysis with a focus on low- and middle-income countries. Int J Hyg Environ Health. 2019 Jun 1;222(5):765-77. Google Scholar
- Alemu G, Abossie A, Yohannes Z. Current status of intestinal parasitic infections and associated factors among primary school children in Birbir town, Southern Ethiopia. BMC Infect Dis. 2019 Dec;19(1):1-8. PubMed | Google Scholar
- Aschale A, Adane M, Getachew M, Faris K, Gebretsadik D, Sisay T et al. Water, sanitation, and hygiene conditions and prevalence of intestinal parasitosis among primary school children in Dessie City, Ethiopia. Plos One. 2021 Feb 3;16(2):e0245463. PubMed | Google Scholar
- Zenu S, Alemayehu E, Woldemichael K. Prevalence of intestinal parasitic infections and associated factors among street children in Jimma town; south West Ethiopia in 2019: a cross sectional study. BMC Public Health. 2019 Dec;19(1):1-10. PubMed | Google Scholar
- Federal Democratic Republic of Ethiopia Ministry of Health. School health program framework. Accessed on Feb 21, 2022.
- UNICEF. Strategy for water, sanitation and hygiene 2016-2030. Accessed on Feb 21, 2022.
- UNICEF. Core questions and indicators for monitoring WASH in schools in the sustainable development goals. Accessed on Feb 21, 2022.
- WHO/UNICEF. Basic water, sanitation and hygiene services in schools. Accessed on Feb 21, 2022.
- WHO/UNICEF. Joint monitoring programme for water supply, sanitation and hygiene. Accessed on Feb 21, 2022.
- UNICEF. 2018 school water, sanitation and hygiene assessment. Accessed on Feb 21, 2022.
- Michigan Technological University. Assessment of water and sanitation infrastructure at primary schools in Rakai District, Uganda. Accessed on Feb 21, 2022.
- Hope R, Katuva J, Nyaga C, Koehler J, Charles K, Nowicki S et al. Delivering safely-managed water to schools in Kenya. Smith School of Enterprise and the Environment, University of Oxford. 2021. Google Scholar
- Morgan C, Bowling M, Bartram J, Lyn Kayser G. Water, sanitation, and hygiene in schools: status and implications of low coverage in Ethiopia, Kenya, Mozambique, Rwanda, Uganda, and Zambia. Int J Hyg Environ Health. 2017 Aug;220(6):950-959. PubMed | Google Scholar
- Science PG. The state of water supply and sanitation in government primary schools in Dares Salaam region a case of Kinondoni municipality. Accessed on Feb 21, 2022.
- Cronk R, Guo A, Fleming L, Bartram J. Factors associated with water quality, sanitation, and hygiene in rural schools in 14 low- and middle-income countries. Sci Total Environ. 2021 Mar 20;761:144226. PubMed | Google Scholar
- Antwi-Agyei P, Mwakitalima A, Seleman A, Tenu F, Kuiwite T, Kiberiti S et al. Water, sanitation and hygiene (WASH) in schools: results from a process evaluation of the national sanitation campaign in Tanzania. J Water Sanit Hyg Dev. 2017 Feb 14;7(1):140-50. Google Scholar
- Unicef WHO. Progress on drinking water, sanitation and hygiene in schools: special focus on COVID-19. Accessed on Feb 21, 2022.
Search
This article authors
On Pubmed
On Google Scholar
Citation [Download]
Navigate this article
Similar articles in
Key words
Tables and figures

Article metrics

