
Using the ARIMA Model to forecast sexual and gender-based violence cases reported to a tertiary hospital in Lusaka, Zambia
Mwansa Ketty Lubeya, Patrick Kaonga, Jane Chanda Kabwe, Namunji Matale, Jane Mwamba Mumba, Christabel Chigwe Phiri, Astridah Yikona Maseka, Fadillah Kankasa Mulenga, Eslon Chama, Moses Mukosha, Maureen Chisembele, Bellington Vwalika, Chipepo Kankasa
Corresponding author: Mwansa Ketty Lubeya, Department of Obstetrics and Gynaecology, The University of Zambia-School of Medicine, Lusaka, Zambia 
Received: 26 Dec 2020 - Accepted: 10 May 2021 - Published: 11 May 2021
Domain: Community health,Health Research
Keywords: ARIMA, forecasting, Zambia, COVID-19, gender-based violence, sexual assault, box jerkins, sub-Saharan Africa
©Mwansa Ketty Lubeya et al. PAMJ-One Health (ISSN: 2707-2800). This is an Open Access article distributed under the terms of the Creative Commons Attribution International 4.0 License (https://creativecommons.org/licenses/by/4.0/), which permits unrestricted use, distribution, and reproduction in any medium, provided the original work is properly cited.
Cite this article: Mwansa Ketty Lubeya et al. Using the ARIMA Model to forecast sexual and gender-based violence cases reported to a tertiary hospital in Lusaka, Zambia. PAMJ-One Health. 2021;5:4. [doi: 10.11604/pamj-oh.2021.5.4.27590]
Available online at: https://www.one-health.panafrican-med-journal.com/content/article/5/4/full
Research 
Using the ARIMA Model to forecast sexual and gender-based violence cases reported to a tertiary hospital in Lusaka, Zambia
Using the ARIMA Model to forecast sexual and gender-based violence cases reported to a tertiary hospital in Lusaka, Zambia
![]() Mwansa Ketty Lubeya1,2,3,&, Patrick Kaonga4,5,
Mwansa Ketty Lubeya1,2,3,&, Patrick Kaonga4,5, ![]() Jane Chanda Kabwe2,6,
Jane Chanda Kabwe2,6, ![]() Namunji Matale1,2, Jane Mwamba Mumba1,2,3, Christabel Chigwe Phiri2,7, Astridah Yikona Maseka1,3, Fadillah Kankasa Mulenga8, Eslon Chama8,
Namunji Matale1,2, Jane Mwamba Mumba1,2,3, Christabel Chigwe Phiri2,7, Astridah Yikona Maseka1,3, Fadillah Kankasa Mulenga8, Eslon Chama8, ![]() Moses Mukosha9, Maureen Chisembele1,3,
Moses Mukosha9, Maureen Chisembele1,3, ![]() Bellington Vwalika1,2,3, Chipepo Kankasa8
Bellington Vwalika1,2,3, Chipepo Kankasa8
&Corresponding author
Introduction: sexual and gender-based violence (SGBV) is a global public health problem and women are disproportionally affected. Sexual and gender-based violence has an acute and chronic impact on health. We set out to apply autoregressive integrated moving average (ARIMA) models to make predictions on the number of SGBV cases reported to the Women and Newborn Hospital of the University Teaching Hospitals in Lusaka, Zambia.
Methods: we retrospectively collected monthly number of SGBV cases from April 2017 to December 2019 as a primary outcome measure. We utilized the following strategy for the analysis; we developed the Box-Jerkins methodology through identification, estimation and diagnostic checks before using the model for forecasting. Structural ARIMA models were used to model the number of SGBV cases. We considered the simplest parsimonious lowest order model based on the lowest volatility, highest log-likelihood value, most significant coefficients, and the lowest Akaike information criteria and Bayesian information criteria values.
Results: the ARIMA (1,1,1) model was able to forecast the number of SGBV cases. The forecasted mean monthly was 31.7 (95% CI: 29.9-33.3). The prediction error assessed by mean absolute percentage error was 10.3%, and the root mean standard error was 6.6. Further, a comparison of the observed and predicted values showed no statistically significant difference (p=0.753).
Conclusion: the ARIMA model can be a useful tool for planners and clinicians to manage survivors of sexual and gender-based violence at the Women and Newborn Hospital.

Gender-based violence (GBV) is recognized as a health problem affecting people worldwide, worst experienced by women [1]. Estimates show that at least 31% of all women have experienced some form of GBV in their lifetime [2]. Violence against women is defined as “any act of gender-based violence that results in, or is likely to result in, physical, sexual, or mental harm or suffering to women, including threats of such acts, coercion or arbitrary deprivation of liberty, whether occurring in public or in private life" [3]. Gender-based violence includes a wide range of acts such as physical, sexual, and psychological abuse from intimate partners or non-partners [1]. The overall prevalence of all forms of GBV is high in sub-Saharan Africa [4]. In a systematic review by Muluneh and others found that sub-Saharan Africa had a pooled prevalence of 76% associated with factors such as place of residence, marital status, use of illicit drugs and education status [4]. The 2018 Zambia demographic health survey shows that up to 36% of women aged 15-49 years have experienced GBV, and 14% of these have experienced sexual violence in their lifetime [5].
Gender-based violence reporting is usually low, and in most instances, cases seen are a tip of the iceberg especially in the developing world [6]. Despite the under-reporting of GBV cases in most regions, many women face diverse health problems as a result [6]. Health problems affecting survivors of GBV include; physical injuries, mental health disorders, sexually transmitted infections, anaemia in pregnancy, adverse pregnancy outcomes, non-communicable diseases, drug abuse, that further impacts the health and wellbeing of their children [7-10]. At the national and economic level, SGBV harms a country's human, social, and economic development and is an underlying obstacle to eliminating poverty [11]. Further, the COVID-19 global pandemic has been associated with an increase in the number of SGBV cases, especially intimate partner violence, as seen during other pandemics [12]. There is limited information in Zambia, predicting cycles when women are at increased risk of experiencing SGBV and report to the Women and Newborn Hospital of the University Teaching Hospitals (WNH-UTH) one-stop centre. This study focuses on SGBV, to forecast the number of cases reported to the one-stop centre at a tertiary institution and determine possible cycles of increased reporting.

Data source: we collected monthly data on SGBV survivors from the one-stop centre domiciled at the WNH-UTH for 1st April 2017 to 31st December 2019. The collected numbers formed 36 periods. It is expected that the cases represent only the reported number of cases, who are willing to seek help. Majority of these survivors end up at this hospital for further management; additionally, this is one of the few facilities caring for SGBV survivors 24 hours a day, including during holidays and weekends. However, these numbers could only be a tip of the iceberg as most women suffer in silence and do not report the violence. Even at this same facility, survivors could have reported to other departments and were not referred to the one-stop centre.
Modelling of time series: the Auto-Regressive Integrated Moving Average (ARIMA), also known as the Box-Jerkins methodology, was used to model the time-series and was applied to cases of sexual gender-based violence. This methodology is based on autocorrelation within the time series and the time interval must be equally spaced. The model's construction should be done on stationery data (constant mean and variance over time). It is applied on the count of continuous data, and others have suggested that there should be at least 50 observations [13] while others have also indicated at least 30 observations.
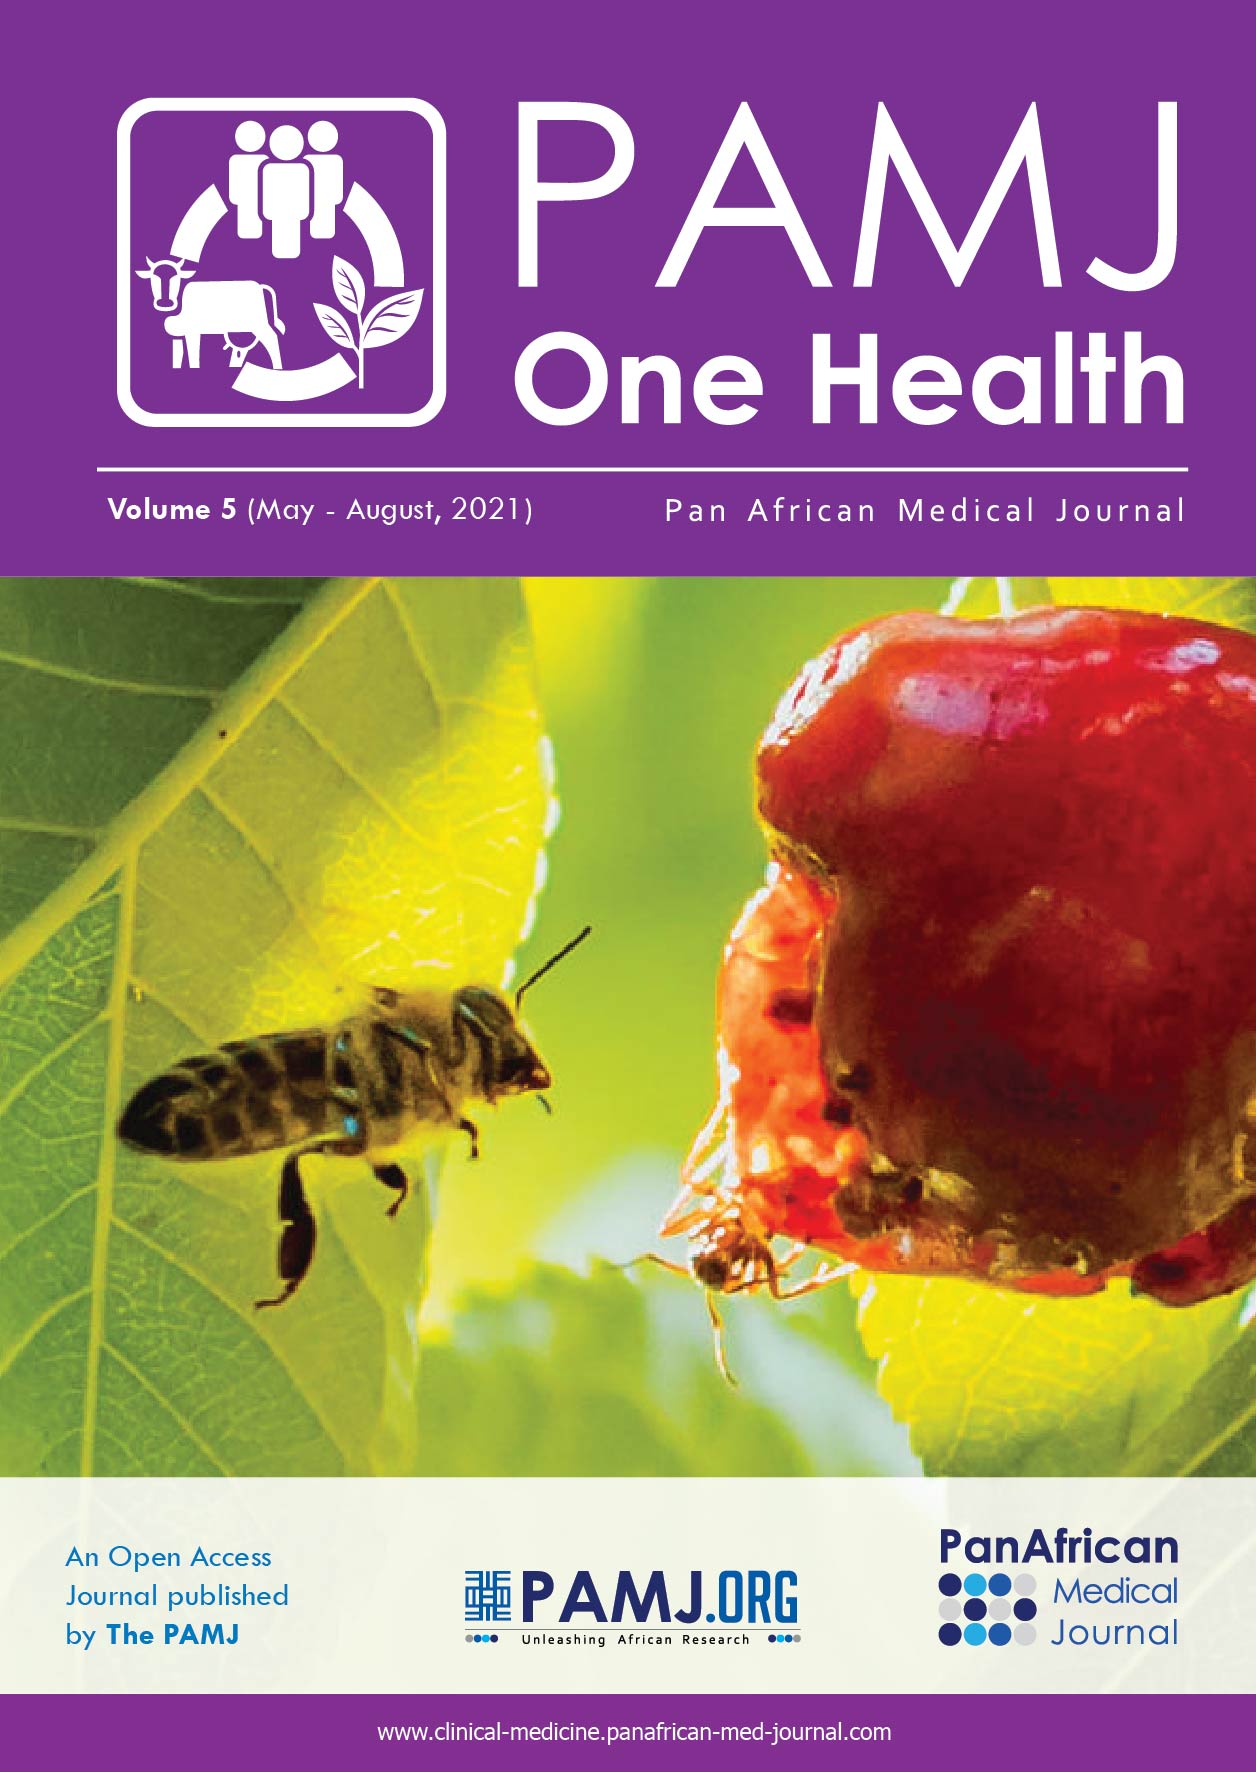
Notation of the ARIMA: a very valuable notation to describe the components of the ARIMA model is given by: p = order of the autoregressive (AR) component of the ARIMA model; d = order of differencing; q = order of the moving average (MA) component of the ARIMA model is an error in the difference; between the observed and estimated values. Modelling of the Box-Jenkins methodology has four main steps: identification, estimation, diagnostics and forecasting.
Step 1: model identification: model identification requires that the data is stationary. Stationary data needs that there is no systematic changes in the mean and variance as well as no periodic variation. This was achieved by first differencing the data. The graphical tools that were used to identify the model are autocorrelation function (ACF) and partial autocorrelation function (PACF). The ACF and PACF were used to decide suitable moving average and autoregressive respectively. To further confirm stationarity of data, the Augmented Dickey-Fuller test was used, the p-value was statistically significant (p=0.003) suggesting stationarity of data.
Step 2: model estimation: the tentative models that were obtained from the plots of ACF and PACF were used for estimation to select the appropriate model. All models were estimated and the appropriate model selection was based on the one with the lowest volatility, highest log likelihood value, most significant coefficients and with lowest AIC and SBIC values.
Step 3: model diagnostic checks: to test for the adequacy of the selected ARIMA model, the residuals of the fitted model to find the ACF plot of the residuals were checked for normal distribution and the portmanteau (Q) test was performed to test presence of white noise. Further, the Q-Q plot and Shapiro-Wilk test were performed to test for normality of the residuals. After diagnostic tests were performed, if results were within acceptable limits, the ARIMA model was considered appropriate.
Step 4: forecasting: the model that was considered appropriate was selected and was used to forecast SGBV cases. In order to evaluate the model and forecast accuracy, data were divided into two groups: first, one for model development (January 2017 to March 2019) and the other for model validation (April 2019 to December 2019). Forecast accuracy was assessed using mean absolute percentage error (MAPE). All data analyses were conducted using STATA 15 (STATA Corp, College Station, Texas, USA) with p <0.05 was considered statistically significant. The steps used in the methodology have been summarized in Figure 1.
Ethical considerations: permission to conduct the study was obtained from the Director University Teaching Hospital HIV/AIDS Program and WNH-UTH Management. Ethical approval was given by the University of Zambia School of Medicine Undergraduate Research Ethics Committee.
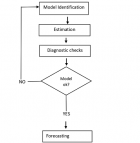
From January 2017 to December 2019, there was a total of 1,145 SGBV cases that presented to the WNH- University Teaching Hospital of whom almost everyone (99.2%) was female with 31.8 as the average number of cases reporting per month. Five hundred and seven (44.2%) were given Post Exposure Prophylaxis for HIV (PEP), 63 individuals sero-converted (initially were HIV negative, but later tested HIV positive one month after being raped) and sixty -five individuals did not qualify for PEP because they were already HIV positive before the sexual assault took place. In the time series plot of monthly cases of SGBV, there were no periodic or seasonal trends observed. The Augmented Dickey-Fuller (ADF) test results showed the presence of unit root (z (t) = -0.852, p=0.835, lags=15) suggesting that the series was not stationary (Figure 2 A). But after first order differencing of monthly rape cases, the series became stationary (Figure 2 B), and all further statistical analyses were conducted on stationary data.
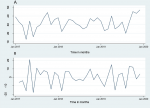
In order to identify the appropriate lags for the AR and MA process, we used the correlograms (plots of ACF and PACF against lags lengths), ACF and PACF (Figure 3). The first lag of the ACF was significant (outside the 95% CI band). For the PACF, the first lag was significant as well as lag 14 with decaying over time. Based on the ACF and PACF plots, tentative models were identified. Using the log-likelihood, Sigma-squared (volatility), number of significant coefficients, Akaike information criteria (AIC) and Bayesian information criteria (BIC) initially first order differenced were assessed followed by non-differenced models. We based our model identification on the one with the highest log-likelihood ration, lowest sigma-squared (volatility), the highest number of significant coefficients, lowest Akaike information criteria (AIC) and lowest Bayesian information criteria (BIC). We identified the ARIMA (1,1,1) model as the most ideal (Table 1). AIC = Akaike information criteria; BIC = Bayesian information criteria.
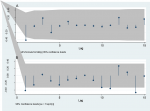
ARIMA (1,1,1) diagnostics: the correlogram for ACF for the residuals was flat (all the lags were within 95% confidence interval) indicating all the information was captured (white noise). Although for the PAC correlogram, there was a significant lag 15, for the sake of parsimonious model and to avoid over-parameterized model, the lag was not considered. Therefore, ARIMA (1,1,1) model was used for forecasting (Figure 4). Both ACF and PACF correlogram results were supported by the portmanteau Q-test (Q15=8.92, p=0.8816), suggesting that there was no autocorrelation in the residuals. Furthermore, the skewness-kurtosis test (X2 =1.06, p= 0.588) was in keeping with normality assumption of the model residuals.
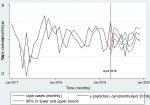
Forecasting: when observed and predicted values of SGBV cases were plotted, the data seemed to fit well (Figure 4). The forecasted mean monthly rape case was 31.7 (95% CI = 29.9 - 33.3, Figure 5). The prediction error was assessed by mean absolute percentage error (MAPE) which was 10.3%, and root mean standard error 6.6 rape cases. Further, a comparison of the observed and predicted values by a T-test showed no statistically significant difference (p=0.753).
To the best of our knowledge, we report for the first time the use of a recognized statistical technique such as ARIMA model to forecast the number of SGBV cases reported to the Women and Newborn Hospital of the University Teaching Hospitals in Lusaka, Zambia. Our fitted model suggests that to predict monthly SGBV cases; there is a need for first-order differencing of the series to make data stationery. Our results imply that the number of cases reported every month is directly impacted by SGBV cases in the previous month. Several studies and human rights entities have reported that SGBV remains a public health problem, especially in areas with increased urbanization, high unemployment rates and poverty levels, and destabilized communities due to war [14]. The SGBV survivors suffer physical and mental harm, including STIs, anxiety, depression, posttraumatic stress, unwanted pregnancies and unsafe abortions [15,16].
ARIMA models have been used in different sectors such as economics [17], finance [18] and the health sector. In the healthcare sector, the model has been used in forecasting many diseases such as future malaria incidences in Ghana [19], the prevalence of opportunistic infections in HIV patients in Uganda [20], epidemiology of positive-rate of influenza viruses in China [21] and trends of malaria cases and deaths in Ethiopia [22] and epidemic situations of brucellosis in China [23]. Many reports have suggested that time series analysis models such as ARIMA models are suitable to analyze and predict trends over time than simple trends analysis as they are less prone to specification errors [24]. ARIMA models could be used to forecast trends with reasonable accuracy. Accurate forecasts may provide early warning for the future so that planners can allocate resources for appropriate interventions and resource allocation at the facility.
Our eight-month forecast was quite reasonable since accuracy measures such as MAPE were low, and there was no difference between the observed and predicted values. With such an ARIMA model, planners and implementers can allocate a sufficient number of staff for counselling and supplies such as antiretroviral therapy for HIV post-exposure prophylaxis, emergency contraception to prevent pregnancy, HIV and pregnancy testing kits, and test kits for other sexually transmitted diseases. In this study, findings provide vital evidence to inform policy in-line with 2030 sustainable development goals to eliminate all forms of violence against women.
Limitations and recommendations: firstly, our model has 36-time points short of what others have suggested that the minimum time point for an ARIMA model should be 50. Our number of points may have led to an unstable model; however, we had reasonable accuracy measures. Secondly, we may not have captured all the SGBV cases, possibly because not all survivors reported to the WNH-UTH. Since we did not consider covariates in the model, there is the potential of unmeasured confounders like characteristics of the perpetrator. In situations like this, results could be affected; however, such information was not available at data collection time and it was not the author´s intention to collect the survivor´s data or that of the perpetrator. ARIMA model may change given that other hospitals and one-stop centres in the city may begin to offer similar services over which we have no control. Additionally, the cases reported could be a tip of the iceberg of the problem's magnitude due to low reporting rates. We highly recommend that similar studies be done in other facilities dealing with SGBV within the country and around the continent to forecast number of cases.
What is known about this topic
- There is a high prevalence of SGBV across the globe and intimate partner violence is one of the commonest forms of sexual violence experienced by women, this has been exacerbated by the current COVID-19 pandemic;
- Zambia has a high prevalence of different forms of SGBV.
What this study adds
- For the first time we have used the ARIMA model to forecast reporting cycles of SGBV cases in Zambia to help in planning and improved management of survivors;
- This paper serves as a pilot on the use of the ARIMA model in the field of GBV, hence can be replicated and used by other institutions managing SGBV to forecast reporting cycles.
The authors declare no competing interests.
MKL: conceptualized and wrote the study plan, analyzed and drafted the manuscript; JCK: draft manuscript writing, PK: conceived the study design, contributed to the study design, data analysis and drafted the manuscript. JM, NM and CCP: collected and cleaned up the data. MKL, JCK, PK, JM, CCP, NM, AM, EC, FKM, MM, MC, BV, CK read and approved the final manuscript. All the authors have read and agreed to the final manuscript.
The authors are grateful to the Women and Newborn Hospital of the University Teaching Hospitals Lusaka Zambia for providing the data for this operational research. Further we thank Mary Masiye, Mary Phiri and Manase Nenechi for their assistance during data collection and James Chishimba for assistance with collecting the data.
Table 1: ARIMA model estimation
Figure 1: summary of methodology
Figure 2: original monthly SGBV cases (A) and first-order differenced monthly SGBV cases 2017-2019 (B)
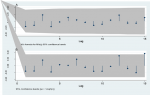
Figure 3: autocorrelation function (ACF) (A) and partial autocorrelation function (PACF) for the first order differenced SGBV monthly cases (B)
Figure 4: plot of residuals autocorrelation function (ACF) (A) and partial autocorrelation (PACF) for ARIMA (1,1,1) to forecast monthly SGBV cases (B)
Figure 5: observed and predicted values of monthly SGBV cases from the fitted ARIMA (1,1,1) model with their corresponding 95% confidence interval
- Garcia-Moreno C, Heise L, Jansen HA, Ellsberg M, Watts C. Public health, Violence against women. Science (New York, NY). 2005;310(5752):1282-3. PubMed | Google Scholar
- Muluneh MD, Stulz V, Francis L, Agho K. Gender based violence against women in sub-Saharan Africa: a systematic review and meta-analysis of cross-sectional studies. International Journal of Environmental Research and Public Health. 2020;17(3). PubMed | Google Scholar
- Assembly Ung. Declaration on the elimination of violence against women proclaimed by general assembly resolution 48/104 of 20 December 1993 New York. 1993.
- Beyene AS, Chojenta C, Roba HS, Melka AS, Loxton D. Gender-based violence among female youths in educational institutions of sub-Saharan Africa: a systematic review and meta-analysis. Systematic reviews. 2019;8(1):59. PubMed | Google Scholar
- Zambia Statistics Agency, ICF. Zambia demographic and health survey 2018. Lusaka, Zambia, Rockville, Maryland. 2019.
- Palermo T, Bleck J, Peterman A. Tip of the iceberg: reporting and gender-based violence in developing countries. American Journal of Epidemiology. 2014;179(5):602-12. PubMed | Google Scholar
- Loeffen MJW, Lo Fo Wong SH, Wester FPJF, Laurant MGH, Lagro-Janssen ALM. Are gynaecological and pregnancy-associated conditions in family practice indicators of intimate partner violence. Family Practice. 2016;33(4):354-9. PubMed | Google Scholar
- Roberts ST, Flaherty BP, Deya R, Masese L, Ngina J, McClelland RS et al. Patterns of gender-based violence and associations with mental health and HIV risk behavior among female sex workers in Mombasa, Kenya: a latent class analysis. AIDS and behavior. 2018;22(10):3273-86. PubMed | Google Scholar
- Stöckl H, Filippi V, Watts C, Mbwambo JK. Induced abortion, pregnancy loss and intimate partner violence in Tanzania: a population based study. BMC Pregnancy and Childbirth. 2012;12:12. PubMed | Google Scholar
- Lubeya MK, Vwalika B. Anaemia in pregnancy among women in Lusaka District- Zambia. Medical Journal of Zambia. 2017;44 (4):238-243. Google Scholar
- Adrienne Cruz and Sabine Klinger: (Geneva I, 2011). Gender-based violence in the world of work: overview and selected annotated bibliography. World of work magazine. 2011.
- Axios. China´s domestic violence epidemic . 2020. Accessed December 26, 2020.
- Kale PL, Andreozzi VL, Nobre FF. Time series analysis of deaths due to diarrhoea in children in Rio de Janeiro, Brazil, 1980-1998. Journal of Health, Population, and Nutrition. 2004;22(1):27-33. PubMed | Google Scholar
- Menard KS, Ruback RB. Prevalence and processing of child sexual abuse: a multi-data-set analysis of urban and rural counties. Law and Human Behavior. 2003;27(4):385-402. PubMed | Google Scholar
- Shahali S, Mohammadi E, Lamyian M, Kashanian M, Eslami M, Montazeri A. Barriers to healthcare provision for victims of sexual assault: a grounded theory study. Iran Red Crescent Med J. 2016;18(3):e21938-e. PubMed | Google Scholar
- Martsolf DS, Draucker CB, Cook CB, Ross R, Stidham AW, Mweemba P. A meta-summary of qualitative findings about professional services for survivors of sexual violence. Qual Rep. 2010;15(3):489-506. PubMed | Google Scholar
- Mgaya JF. Application of ARIMA models in forecasting livestock products consumption in Tanzania. Cogent Food and Agriculture. 2019;5(1):1607430. Google Scholar
- Mallikarjuna M, Rao RP. Evaluation of forecasting methods from selected stock market returns. Financial Innovation. 2019;5(1):40. Google Scholar
- Anokye R, Acheampong E, Owusu I, Isaac Obeng E. Time series analysis of malaria in Kumasi: using ARIMA models to forecast future incidence. Cogent Social Sciences. 2018;4(1):1461544. Google Scholar
- Rubaihayo J, Tumwesigye NM, Konde-Lule J, Makumbi F. Forecast analysis of any opportunistic infection among HIV positive individuals on antiretroviral therapy in Uganda. BMC Public Health. 2016;16(1):766. PubMed | Google Scholar
- He Z, Tao H. Epidemiology and ARIMA model of positive-rate of influenza viruses among children in Wuhan, China: a nine-year retrospective study. International Journal of Infectious Diseases. 2018;74:61-70. PubMed | Google Scholar
- Aregawi M, Lynch M, Bekele W, Kebede H, Jima D, Taffese HS et al. Time series analysis of trends in malaria cases and deaths at hospitals and the effect of entimalarial interventions, 2001-2011, Ethiopia. PLOS ONE. 2014;9(11):e106359. PubMed | Google Scholar
- Wang L, Liang C, Wu W, Wu S, Yang J, Lu X et al. Epidemic situation of brucellosis in Jinzhou City of China and prediction using the ARIMA model. Canadian Journal of Infectious Diseases and Medical Microbiology. 2019 Jun 13;2019:1429462. PubMed | Google Scholar
- Farmer RD, Emami J. Models for forecasting hospital bed requirements in the acute sector. Journal of Epidemiology and Community Health. 1990;44(4):307-12. PubMed | Google Scholar
Search
This article authors
On Pubmed
On Google Scholar
Citation [Download]
Navigate this article
Similar articles in
Key words
Tables and figures
Article metrics

