
Epidemiology of typhoid fever in Morocco (2011 -2017): spatial clusters and associated environmental factors
Mina Sadeq, Fatima Zahra El Moussaoui, Mohammed Lakranbi, Nabila Auajjar, Banaissa Attarassi
Corresponding author: Mina Sadeq, Environmental Epidemiology Unit, National Institute of Hygiene, Ministry of Health, Rabat, Morocco 
Received: 14 Apr 2020 - Accepted: 17 May 2020 - Published: 18 May 2020
Domain: Hygiene and sanitation,Water resources,Epidemiology
Keywords: Typhoid fever, spatial clusters, water supply, wastewaters evacuation, Morocco
©Mina Sadeq et al. PAMJ-One Health (ISSN: 2707-2800). This is an Open Access article distributed under the terms of the Creative Commons Attribution International 4.0 License (https://creativecommons.org/licenses/by/4.0/), which permits unrestricted use, distribution, and reproduction in any medium, provided the original work is properly cited.
Cite this article: Mina Sadeq et al. Epidemiology of typhoid fever in Morocco (2011 -2017): spatial clusters and associated environmental factors. PAMJ-One Health. 2020;2:5. [doi: 10.11604/pamj-oh.2020.2.5.22532]
Available online at: https://www.one-health.panafrican-med-journal.com/content/article/2/5/full
Research 

Epidemiology of typhoid fever in Morocco (2011 -2017): spatial clusters and associated environmental factors
Epidemiology of typhoid fever in Morocco (2011 -2017): spatial clusters and associated environmental factors
Mina Sadeq1,&, Fatima Zahra El Moussaoui2, Mohammed Lakranbi3, Nabila Auajjar2, Banaissa Attarassi2
1Environmental Epidemiology Unit, National Institute of Hygiene, Ministry of Health, Rabat, Morocco, 2Laboratory of Biology and Health, Faculty of Sciences, Ibn Tofail University, Kénitra, Morocco, 3Division of Health and Environment, Directorate of Epidemiology and Diseases Control, Ministry of Health, Rabat, Morocco
&Corresponding author
Mina Sadeq, Environmental Epidemiology Unit, National Institute of Hygiene, Ministry of Health, Rabat, Morocco
Introduction: few population-based studies on typhoid fever (TF) have examined spatial clustering or investigated association between water supply and wastewaters evacuation modes in Morocco. This study aimed at investigating TF spatial clusters and TF-associated environmental factors, between 2011 and 2017.
Methods: country-surveillance and population census data were used. An exploratory spatial data analysis was conducted to assess the global and local patterns of spatial autocorrelation of TF adjusted rates and environmental variables (Moran�s I and local indicator of spatial association (LISA)) at the prefecture/province level. Effects of drinking water access, required clean water amount, and modes of wastewaters evacuation were assessed via regression models.
Results: TF spatial distribution was random in Morocco, whereas environmental variables were strongly clustered in space (P-Moran�s I < 0.01). Water supply was not associated with TF, whereas the use of the different modes of wastewaters evacuation had an effect on TF rates, but contributed only 14% to TF.
Conclusion: further researches at the household or individual level are needed to understand specific risk factors in the identified endemic provinces/prefectures.

Typhoid Fever (TF) is an acute, possibly fatal disease. It is caused by Salmonella Typhi, a bacterium that may grow in intestines and blood of human beings. Such condition is mainly due to poor hygiene, inadequate sanitation and drinking water contaminated with the faeces of infected people. Overcrowding also seems to be associated with that affection [1]. TF is endemic in various corners of the world; however, it has been indicated that more population-based studies on such disease are needed in emerging and developing countries [2-7]. Estimating country figures can inform global health statistics; having information on TF at the country level can help policy-makers understand which areas are most in need of prevention and control measures. In Morocco, one of the North African countries, updating information on TF may be needed for many reasons. First, a few population-based studies on TF were conducted in Morocco in the latest years; none of them was based on comprehensive surveillance data at the country level, which may have allowed comparison between suspected endemic and non-endemic provinces/prefectures. Second, new cases have been regularly found in particular locations, others have emerged in new locations; we wonder if such cases are merely isolated events or there are spatial clusters of TF in Morocco. Third, accurate factors associated with such disease remain uncertain in Morocco. Few population-based studies examined water supply and sewage disposal systems as covariates. More importantly, in previous outbreaks, for one reason or another, matrices such as drinking water, wastewaters and consumed food may fail to be all analyzed for Salmonella Typhi, and the investigation may be restricted only to cases. Updating information on TF would provide further insight into the disease and would target interventions in Morocco. Based on available, recent country-surveillance data from 2011 to 2017, we investigated spatial clusters and examined association between such disease and some a priori, potential environmental variables, including access to clean water supply, the delivered quantity of clean water (in liter per capita per day) to meet the domestic basic needs, and the adopted mode of wastewaters evacuation (i.e., sewage systems, septic tanks or others). All this was performed at the province/prefecture level.

Setting and study population: Morocco is administratively divided into 12 regions, which includes 75 provinces/prefectures. A shapefile map of the 75 provinces/prefectures was obtained from the National Agency for Land Conservation, Cadastre and Cartography. Data on population size by province/prefecture were obtained from �Sant� en Chiffres� files made available by the Service of Studies in Health and Health Information-Ministry of Health [8]. Morocco�s population was 30 079 000 in 2011, increasing to 32 951 000 in 2017 [8].
Data on typhoid fever: in Morocco, TF was under mandatory notification since 1995 (Act N�683-95 of March 31, 1995, related to notifiable diseases in Morocco). The country reported data on typhoid and paratyphoid fever (combined data). Each physician from the public or the private sector should report cases of TF to the health authority at the province/prefecture level. The adopted case definition for TF in Morocco is “an illness that is characterized by insidious onset of sustained fever, headache, abdominal pain, anorexia, constipation, relative bradycardia and rose spots on the abdominal skin” [9]. Compiled data on cases of TF by province/prefecture and by year were made available by the Ministry of Health [10]. Data for the years 2018 and 2019 were not yet available.
Data on clean water quantity: according to WHO, a basic water requirement to meet the four domestic basic needs (i.e. drinking, sanitation, bathing and cooking) was 50 liters per capita per day of clean water [11,12]. Clean water is drinking water from the public water system. Prior to distribution, clean water was subject to treatment and chlorination to meet safety guidelines as a drinking water; the water delivery system is maintained. Constraint of data for some provinces made us to consider data on water production for the years 2015, 2016 and 2017 [13]. Such data were expressed in millions of cubic meters per year by province/prefecture. We calculated the mean amount of water production; the quantity of water made available in liter per capita per day and by prefecture/province was calculated as the mean amount of water production divided by the population size of the year 2016.
Data on households that have access to clean water supply: data on the percentage of households that have access to clean water, by province/prefecture, were freely accessible from the Moroccan Census Bureau and available only for the year 2014 [14]. The total number of households was 7 313 806 and the mean size of a household was 4.6 persons [14].
Data on households evacuating wastewaters according to three modes: in Morocco, wastewaters may be evacuated via a domestic system (mode A), septic tanks (mode B) or nearby, i.e. in abandoned well or directly in the nature (Mode C). According to the recent census, a proportion of 58.9 % of the population used mode A, 23.2 % used mode B, and 17.9 % used mode C [14]. Data on the percentage of households using each mode of wastewater evacuation, by province and prefecture, were freely accessible from the Moroccan Census Bureau and available for the year 2014 [14]. The total number of considered households was 7 313 806 [14].
Statistical analysis: we performed an approximate two-sided Kendall�s rank correlation test to examine variation in TF notification rate from 2011 to 2017 at the national level; the P-values and size effects of which were given. We also calculated an annual Poisson notification rate of TF and a Poisson rate confidence interval. This was estimated as the number of events observed divided by the time at risk of event during the observation period. Furthermore, we calculated rates by province/prefecture and by year, checked for variance instability of such rates, and identified outliers. A Kendall�s rank test was conducted to evaluate variation in rate in such outliers or selected prefectures/provinces (statistics were calculated in exact form). All rates were expressed in 100000 population per year. StatsDirect statistical software version 3.0.194 (StatsDirect Ltd., Cheshire, UK) was used to perform such statistical analyses.
Global spatial clustering of typhoid fever: spatial and nonspatial data corresponding to the 75 provinces/prefectures were joined using QGIS (version 2.0.1 “Dufour”). As the province/prefecture�s area and the population size may vary, the spatial empirical bayes rate (i.e. adjusted rate) of TF was calculated. The exploratory spatial data analysis approach (ESDA) [15,16] was then used to examine global patterns of spatial autocorrelation in TF adjusted rates. Queen contiguity was adopted and Moran�s I statistic test was used. A positive significant Moran�s I indicates clustering in space of similar TF rates. GeoDa software version 1.6.7.9, March 2015 (ASU, GeoDa Center for Geospatial Analysis and Computation, Arizona, USA) was used to perform ESDA.
Specifying a regression model of TF: the influence of previously cited predictors on TF was evaluated by means of the ordinary least squares regression (OSR). Data on water availability in liter per capita per day and by prefecture/province were evaluated as dummy variables. Prior to conducting regression analysis, we checked dependency between variables to identify independent variables to include in the model. GeoDa software was used for such statistical analyses.
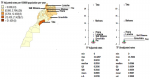
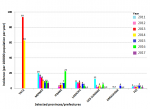
A decrease in TF rate was seen from 2011 to 2017 in Morocco (Kendall�s tau b=− 0.72 and P = 0.02). Over the study period, the total notified cases were 1706 with a maximum number of 672 cases in the prefecture of Meknes and a minimum number of zero cases in 25 provinces/prefectures. The Poisson annual rate was 0.7 per 100 000 population per year at 95% CI: 0.7-0.8. Figure 1 showed a map of TF notification rates by province/prefecture (in left) and patterns of box plots of adjusted and unadjusted rates (in right). Patterns of box plots, both identifying seven outliers, were similar for adjusted and unadjusted rates; these outliers were the province of Tata (21.43 per 100000 population per year), the prefecture of Meknes (2.43 per 100000 population per year), the province of Ifrane (5.84 per 100000 population per year), the province of Larache (4.77 per 100000 population per year), the province of Sidi Slimane (3.88 per 100000 population per year), the province of Errachidia (2.13 per 100000 population per year, and the prefecture of Fez (1.73 per 100000 population per year) (Figure 1). We examined variation in TF by such selected provinces/prefecture. Pics in TF were observed in the provinces of Tata in 2013 and 2014, Ifrane in 2016 and Sidi Slimane in 2011; however, the decreased rates was evident only in the prefecture of Meknes (Kendall�s tau b=− 0.81 and P < 0.002) and the province of Larache (Kendall�s tau b=− 0.62 and P < 0.02) (Figure 2). Rate did not vary in the remaining five provinces: Kendall's tau b = -0.20 (P = 0.281) for Tata, b = 0.45 (P = 0.119) for Ifrane, b = -0.43 (P = 0.068) for Sidi Slimane, b = -0.10 (P = 0.386) for Errachidia, and b = -0.33 (P = 0.119) for Fez (Figure 2).
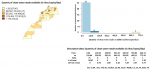
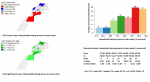
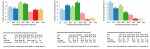
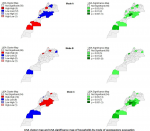
Global univariate Moran�s I statistics, univariate LISA cluster maps, and univariate LISA significance maps of TF rates showed dispersed distribution, but it was not statistically significant at 0.05 level or less (Table 1). Examination of covariates revealed that the quantity of clean water made available exceeded 50 liter per capita per day in only 16% (12/75) of the provinces/prefectures of Morocco. Both descriptive data on the delivered quantity of clean water, expressed in liter per capita per day, and the distribution of such variable by province/prefecture were shown in Figure 3, in right and left, respectively. In 95% of the provinces/prefectures, such quantity varied between 0.3 and 110.6 liter/capita/day (Figure 3, in right). The quantity of clean water made available exceeded 56 liter/capita/day in only 15 % (11/75) of the provinces/prefectures of Morocco (Figure 3, in left), 110 liter/capita/day in four prefectures (Figure 3, in right). The mean quantity was about 41 liter/capita/day, but the value of standard deviation showed disparities between provinces/prefectures (Figure 3, in right). Spatial clusters of such covariate was not seen (Table 1). Figure 4 displayed both the spread of households that have access to clean water supply (Figure 4, in right) and spatial clustering of such households (Figure 4, in left). A mean percentage of households having access to clean water was about 68%, but the value of standard deviation showed clear variation between provinces/prefectures (Figure 4, in right). Evidence of spatial clusters of such covariate was shown in Table 1. High-high clusters were located in the south-east of the country, while low-low clusters were in some northern and western parts of Morocco (Figure 4, in left).
Figure 5 displayed the spread of households by mode of wastewaters evacuation. About 48.46 % of the households used mode A, 27.97 % used mode B, and 23.56 % used mode C; values of standard deviation showed clear variation between provinces/prefectures (Figure 5). Significant clustering was seen for all modes of wastewaters evacuation (Figure 6 and Table 1). Significant spatial clusters of high spread of mode A were located in some northwestern and southern parts of Morocco, while spatial clusters of low spread were seen in the center of Morocco (Figure 6). Significant spatial clusters of high spread of mode B were located in the provinces of Taounat and Berrchid, while spatial clusters of low spread were seen in the provinces of Jrada and Boujdour; the prefecture of Fahs Anjra was the only high-low cluster (Figure 6). There was spatial randomness in the remaining parts of the country. As to mode C, significant spatial clusters of high spread were mainly located in many provinces in the east of Morocco, while spatial clusters of low spread were seen in some southern parts of Morocco (Figure 6). A positive correlation was seen between households that have access to clean water supply and those that use the sewage network (t-statistic = 6.365 with P < 0.001) whereas a negative correlation was observed between households that have access to clean water supply and those using mode B (t-statistic = - 4.802 with P< 0.001) or mode C (t-statistic = - 4.391 with P< 0.001). This most likely suggested that households connected to the municipal sewage were supplied by municipal water systems, and that the households that used modes B or C were not supplied by municipal water systems. As to regression analyses, a first model for a priori hypotheses included all covariates ; a second principal model was related to clean water supply in terms of access and quantity in liter/capita/day. Another primary model included covariates related to modes of wastewaters evacuation. Table 2 summarized the results of OSR. The regression analysis showed that effect of the independent variables related to water supply on TF was not evident: the variance ratio, F, for the overall regression was statistically not significant (Table 2). Whereas the use of the different modes of wastewaters evacuation had an effect on TF rate: the variance ratio, F, for the overall regression was highly significant, suggesting that mode A, mode B or mode C was, or all, were associated with TF. The r square value showed that only 14% of the variance of TF was accounted for by the regression, therefore the predictive value of this model was low. The partial correlation coefficients were shown to be at the limit of significance but the intercept was significant (Table 2).
TF notification rate was estimated to be 0.7 per 100 000 population per year in Morocco; this was higher than that in Europe where the disease is rare and mainly acquired. In 2014, an EU/EEA notification rate of 0.31 cases per 100 000 were reported in 27 EU/EEA countries [17]; the highest notification rates of 0.65 cases per 100 000 population was reported in France [17]. In Africa, the incidence of TF was still high [4,18]. TF rates dropped over the study period in Morocco, and this was in accordance with the situation elsewhere [5,7]. In Africa, modeled estimates also suggested a slight decrease in incidence since 1990 [19]. Endemic areas and potential previous outbreaks were observed during the study period. We expected that the prefectures of Meknes and Fez, the provinces of Larache, Ifrane or Sidi Slimane, where TF persisted during the study period, would be disease hot spots; this was not the case as no spatial clustering of TF was seen. A previous study carried out on TF in Meknes during the period between 2008 and 2010, suspected wastewaters treated and used for irrigation [20]. This warrants further investigation at the household level, taking into account all possible risk factors and particularly testing consumed food for S. Typhi. Future population-based studies on TF are also required in the remaining endemic areas to identify specific risk factors.
Drinking water from the distribution systems was not associated with TF. In the urban area, the municipal public water system or a public stand point are the main distribution systems, whereas in the rural area, the population may have to use unprotected wells or springs, Matfia (rain water), oueds or rivers for their water needs. According to the recent census, 73 % of the population of Morocco had access to an improved water source, i.e., 91.3 % in the urban area and 37.8 % in the rural area [14]. Previous TF outbreaks were limited in space and time and promptly managed in Morocco. More importantly, they were mainly reported in rural locations, and this was in accordance with our finding. As to wastewaters evacuation, the three identified modes of sewage evacuation had similar effect on TF and low contribution to TF in the country, and this suggested the need of future studies considering further risk factors of TF. Our study has limitations. The study was based on the population level census data, and this may have given only general epidemiological evidence and did not advise on individual exposure. Another limitation was the age related data that were not available, which would have given more insight into TF in Morocco. In spite of these limitations, this study is one of the fewer that considered population data at the country level to examine potential spatial clusters of TF and to investigate potential implication of drinking water access and amount, and modes of wastewaters evacuation in Morocco, and would be a rational basis for giving directions for future studies/interventions in the country.
In spite of its low rates, TF remains endemic in Morocco. Drinking water systems in terms of access or delivered quantity were not associated with TF, and the contribution of the modes of wastewaters evacuation remained low. We identified some endemic provinces/prefectures where further researches at the household or individual level are needed to understand specific risk factors.
What is known about this topic
- More population-based studies on Typhoid Fever (TF) are needed in emerging and developing countries;
- We wonder if cases of TF are merely isolated events or there are spatial clusters of TF in Morocco;
- Potential implication of water supply and modes of wastewater evacuation has never been investigated in Morocco.
What this study adds
- Neither drinking water access nor delivered quantity was associated with TF in Morocco;
- Modes of wastewater evacuation contributed only 14% to TF in the country;
- Further researches at the household or indivudual level are needed in identified endemic provinces/prefectures to understand specific risk factors.
The authors declare no competing interest.
MS conceived the study and wrote the paper. FZE and MS abstracted the data. FZE, ML and MS analyzed data and interpreted the results. ML and MS participated in various stages of the manuscript reviews and revisions. BA and NA gave critical inputs and reviewed the manuscript. All authors discussed the results and contributed to the final manuscript.
We would like to thank the Service of Studies in Health and Health Information-Ministry of Health. Rabat. Morocco. This work did not receive any funding support.
Table 1: global Moran's I statistics
Table 2: regression analyses
Figure 1: descriptive data on TF notification rates, 2011-2017, Morocco
Figure 2: variation in TF rates by selected provinces/prefectures (2011-2017), Morocco
Figure 3: quantity of clean water made available (in liter/capita/day), by province/prefecture, Morocco
Figure 4: spatial clusters and distribution of households that have access to clean water, 2014, Morocco
Figure 5: distribution of households by mode of wastewaters evacuation, 2014, Morocco
Figure 6: LISA Clusters and LISA Significance maps of households by mode of wastewaters evacuation, 2014, Morocco
- Hosoglu S, Celen MK, Geyik MF, Akalin S, Ayaz C, Acemoglu H et al. Risk factors for typhoid fever among adult patients in Diyarbakir, Turkey. Epidemiol Infect. 2006;134(3):612-6. PubMed | Google Scholar
- Ghenghesh KS, Franka E, Tawil K, Wasfy M, Ahmed SF, Rubino S et al. Enteric Fever in Mediterranean North Africa. J Infect Dev Ctries. 2009; 3(10):753-61. PubMed | Google Scholar
- Buckle GC, Walker CLF, Black RE. Typhoid fever and paratyphoid fever: Systematic review to estimate global morbidity and mortality for 2010. J Glob Health. 2012;2(1):010401. PubMed | Google Scholar
- Antill�n M, Warren JL, Crawford FW, Weinberger DM, K�r�m E, Pak GD et al. The burden of typhoid fever in low- and middle-income countries: A meta-regression approach. PLoS Negl Trop Dis. 2017;11(2):e0005376. PubMed | Google Scholar
- Als D, Radhakrishnan A, Arora P, Gaffey MF, Campisi S, Velummailum R et al. Global Trends in Typhoidal Salmonellosis: a systematic review. Am J Trop Med Hyg. 2018 Sep;99(3_Suppl):10-19. PubMed | Google Scholar
- Kim J-H, Im J, Parajulee P, Holm M, Cruz Espinoza LM, Poudyal N, Mogeni OD, Marks F. A Systematic Review of Typhoid Fever Occurrence in Africa. Clin Infect Dis. 2019 Oct 30;69(Suppl 6):S492-S498. PubMed | Google Scholar
- Marchello CS, Hong CY, Crump JA. Global Typhoid Fever Incidence: a Systematic Review and Meta-analysis. Clin Infect Dis Off Publ Infect Dis Soc Am. 2019 Mar 7;68(Suppl 2):S105-S116. PubMed | Google Scholar
- Minist�re de la sant�. Sant� en Chiffres. Etudes et Enqu�tes. 2018.
- Minist�re de la sant�. Guide sur les normes de la surveillance �pid�miologique. Guides & Manuels. 1999.
- Minist�re de la sant�. Publications. Acceuil. 2018.
- WHO. Domestic water quantity, service level and health. Water sanitation hygiene. World Health Organization. 2003. Accessed Apr 18 2020.
- Tarrass F, Benjelloun M. The effects of water shortages on health and human development. Perspect Public Health. 2012;132(5):240-4. PubMed | Google Scholar
- Haut Commissariat au Plan du Maroc. Maroc en chiffres. Maroc en chiffres, 2016, 2017, 2018. Accessed Apr 18 2020.
- Haut Commissariat au Plan du Maroc. RGPH 2014 en tableaux. RGPH 20 2020. Accessed Mar 18 2020.
- Anselin L. Spatial Econometrics: Methods and Models. Springer Netherlands. 1988.
- Anselin L. Local Indicators of Spatial Association-LISA. Geogr Anal. 1995;27(2):93-115. Google Scholar
- European Centre for Disease Prevention and Control. Typhoid and paratyphoid fever - Annual Epidemiological Report, 2016 [2014 data]. European Centre for Disease Prevention and Control. 2016. Accessed Mar 18 2020.
- Mogasale V, Mogasale VV, Ramani E, Lee JS, Park JY, Lee KS et al. Revisiting typhoid fever surveillance in low and middle income countries: lessons from systematic literature review of population-based longitudinal studies. BMC Infect Dis. 2016;16:35. PubMed | Google Scholar
- Institute for Health Metrics and Evaluation. IHME Typhoid Fever CODEm Cause Specific Mortality Rate Estimates. Global Health Data Exchange. 2020. Accessed Mar 27 2020.
- Mouhaddach O, Ben-Daoud M, Vanwambeke S, Kestemont MP, Jaafari S. Analyse spatio-temporelle de la fi�vre typho�de au niveau de la ville de Mekn�s (Maroc). RFST. 2015;1-19. Google Scholar
Search
This article authors
On Pubmed
On Google Scholar
Citation [Download]
Navigate this article
Similar articles in
Key words
Tables and figures
Article metrics

