
The effect of road traffic noise on primary schools in Southern Tanzania: a cross-sectional study on insomnia and daytime hypersomnia
Budodi Walwa Walwa, Abdallah Shaban Mahia, Clara Abraham Macha, Tulamwona Exaud Dumulinyi
Corresponding author: Budodi Walwa Walwa, Waste Management and Sanitation Unit, Maswa District Council P.O. Box 170, Maswa, Tanzania 
Received: 09 Nov 2023 - Accepted: 22 Feb 2024 - Published: 05 Mar 2024
Domain: Public health
Keywords: Aircraft, noise, sleep disturbance, insomnia, daytime hypersomnia
©Budodi Walwa Walwa et al. PAMJ-One Health (ISSN: 2707-2800). This is an Open Access article distributed under the terms of the Creative Commons Attribution International 4.0 License (https://creativecommons.org/licenses/by/4.0/), which permits unrestricted use, distribution, and reproduction in any medium, provided the original work is properly cited.
Cite this article: Budodi Walwa Walwa et al. The effect of road traffic noise on primary schools in Southern Tanzania: a cross-sectional study on insomnia and daytime hypersomnia. PAMJ-One Health. 2024;13:7. [doi: 10.11604/pamj-oh.2024.13.7.42148]
Available online at: https://www.one-health.panafrican-med-journal.com/content/article/13/7/full
Research 
The effect of road traffic noise on primary schools in Southern Tanzania: a cross-sectional study on insomnia and daytime hypersomnia
The effect of road traffic noise on primary schools in Southern Tanzania: a cross-sectional study on insomnia and daytime hypersomnia
![]() Budodi Walwa Walwa1,2,&, Abdallah Shaban Mahia3, Clara Abraham Macha4, Tulamwona Exaud Dumulinyi2
Budodi Walwa Walwa1,2,&, Abdallah Shaban Mahia3, Clara Abraham Macha4, Tulamwona Exaud Dumulinyi2
&Corresponding author
Introduction: road traffic noise has been recognized as a significant environmental stressor with potential health implications, particularly in the context of sleep disturbances among students. This study aimed to investigate the association between road traffic noise exposures and sleep patterns among school students in Iringa municipality, considering various demographic and lifestyle factors.
Methods: a cross-sectional study was conducted with a sample of 425 students from different primary schools, categorized based on their exposure to road traffic noise, 139 in the high-exposure group, 144 in the low-exposure group, and 142 in the control group. Demographic characteristics, noise levels, and sleep patterns were assessed using self-reported surveys, noise measurements, and validated sleep assessment tools. Statistical analyses, including multiple logistic regression models, were employed to explore the relationships between noise exposures and sleep disturbances while adjusting for relevant variables. The Insomnia Severity Index (ISI) and Epworth Sleepiness Scale (ESS) questionnaires were used to evaluate sleep disturbance.
Results: the mean ISI and ESS scores were 7.5 ± 6.1 and 6.2 ± 4.7, respectively, and the average scores were significantly greater in the road traffic noise exposure group, as compared to the non-exposure group. The percentage of the subjects with insomnia and hypersomnia, was also significantly greater in the exposure group, as compared to the control group. The odd ratios for insomnia and daytime hypersomnia were approximately 2 times higher in the noise exposure group, as compared to the control group. The analysis also identified gender, age, class level, and regular exercise as significant factors influencing sleep disturbances. Females, older students, and those in higher class levels exhibited increased vulnerability to sleep disturbances, while engagement in regular exercise demonstrated a protective effect.
Conclusion: the findings highlight the critical impact of road traffic noise on students' sleep quality, emphasizing the need for targeted interventions to mitigate noise exposure, especially in school environments. Collaboration with local authorities for effective traffic management strategies and further research employing objective sleep evaluation methods are recommended to enhance the understanding of this complex relationship. Addressing road traffic noise can contribute to the well-being and academic performance of students, highlighting the importance of creating noise-conscious environments in educational settings.

Noise pollution is a prevalent environmental threat in the modern world, originating from a diverse range of sources, which significantly contribute to the issue of environmental noise contamination [1]. The World Health Organization (WHO) acknowledges noise pollution, defined as undesirable noise resulting from human activities, as a serious public health concern [2,3]. It is noteworthy that noise pollution ranks as the third most harmful factor in the cities [4].
Urban areas experience noise pollution originating from various sources, including road traffic, construction activities, commercial enterprises, airports, and both industrial and residential zones [5]. Among these sources, vehicular traffic stands out as the primary contributor to urban noise production, leading to physiological effects that subsequently contribute to a substantial burden of disease [6]. Globally, traffic noise is a significant contributor to environmental pollution [7] with an estimated loss of one million healthy life years annually attributed to traffic-related noise in Western Europe alone.
The effects of land traffic noise on schools located alongside roads (referred to as roadside primary schools) pose significant challenges, as extended exposure to elevated levels of road traffic noise can potentially result in both learning difficulties and health issues [8,9]. Reports have indicated that students exposed to chronic traffic noise during school hours have displayed significantly compromised academic performance and achievements [9-11]. Noise poses a particular threat to adolescents, who are still undergoing physical development [12,13] and whose educational processes and cognitive development are more susceptible to adverse environmental influences [14].
Noise pollution, particularly from sources like road traffic, has a profound impact on sleep patterns, often resulting in both insomnia and hypersomnia [15]. Loud and disruptive noise during nighttime can hinder the process of falling asleep and lead to frequent awakenings, characteristic of insomnia [16]. These interruptions prevent individuals from achieving deep and restorative sleep causing daytime fatigue, reduced concentration, and mood disturbances [17-19]. On the other hand, noise-induced sleep fragmentation accumulates sleep debt, leading to excessive daytime sleepiness, a hallmark of hypersomnia. This overwhelming urge to nap during the day can impair productivity and academic performance, especially in children.
Furthermore, there is evidence suggesting that the most substantial source of noise affecting speech comprehension in classrooms originates from outside the school premises, particularly from road traffic [20-22]. Noise can disrupt both the teaching and learning processes [23-26]. For example, urban noise has been identified as a significant factor affecting the acoustical clarity of educational settings and the quality of classroom education [26]. Consequently, educational institutions, especially primary schools, rank among the most noise-sensitive areas that require safeguarding against high noise levels, especially within classrooms. This study was conducted in order to investigate the relationship between sleep disturbance and exposure to road traffic noise on primary school students who are living near roads traffic in Iringa municipality.

Study design
The study employs a cross-sectional design to examine the correlation between sleep disruption and the extent of exposure to road traffic noise among primary school students residing in proximity to traffic-congested areas within Iringa municipality.
Study area
Iringa Municipal Council is situated within Iringa District, which is a part of Iringa Region in Tanzania. Geographically, it is positioned between 7 degrees south of the equator and 35 degrees east of the Greenwich Meridian. The municipality's elevation ranges from 1,560 to 2,000 meters above sea level, covering a total land area of 331 square kilometers. It is encircled by Iringa District and Kilolo District to the southeast, forming its boundaries.
Inclusion and exclusion criteria
We deliberately chose two primary schools, namely Saint Dominic and Mlandege Primary School, due to their proximity to road traffic (within a one-kilometer radius). In contrast, Kitwiru Primary School was selected as a control group because it is situated far from the municipality center and away from traffic-heavy roads. To ensure a relevant and informed comparison, we specifically focused on students in class five, six, and seven. This decision was based on the assumption that they possess a greater understanding of noise-related issues and possess advanced reading and writing skills compared to students in classes four, three, two, and one, whom we excluded from our study.
Data collection procedures
Measurement of noise level
Initially, the research conducted measurements of noise levels associated with road traffic noise at Saint Dominic and Mlandege Primary Schools. Second, it sought to measure noise levels at Kitwiru Primary School, which served as the control group since it was not exposed to road traffic noise. Data collection was conducted rigorously, with measurements taken three times a day: in the morning at 8:30 AM (Ante Meridiem), at 02:30 AM, and in the night at 10:30 PM (Post Meridiem). The choice of these specific times was deliberate, considering that 8:30 AM typically had lower noise levels, while 02:30 PM usually witnessed higher noise levels. Furthermore, data was collected on four days each week, namely Monday, Tuesday, Thursday, and Saturday.
To ensure accuracy, both indoor and outdoor noise levels were measured using a digital sound level meter with a weighting system and a resolution of 0.1 dBA (A-weighted decibels). This extensive evaluation of noise levels took place for three weeks in August 2022, encompassing all three primary schools. For indoor noise measurements, the sound level meter was strategically placed at a minimum distance of 1 meter from the classroom walls, positioned 1.5 meters above the floor, and set approximately 1.5 meters away from the windows. In contrast, outdoor noise level measurements were conducted with the sound level meter positioned either 1 meter from the school boundary or at a distance of 5 meters from the school building, facing the outdoor noise source.
Survey tool
Following the measurement of noise levels, the study proceeded to assess sleep disturbances in all three primary schools in September 2022. Sleep disturbance was assessed using survey tools designed for insomnia and daytime hypersomnia. To measure insomnia, the researchers utilized the Insomnia Severity Index (ISI) [15,25]. This self-reported questionnaire comprises seven questions that evaluate various aspects of sleep difficulties, including problems with sleep onset and maintenance, satisfaction with one's current sleep pattern, interference with daily functioning, perception of impairment caused by the sleep issue, and the level of distress or concern it provokes. Each question is assigned a score between 0 and 4, with higher scores indicating more severe insomnia. The total ISI score falls within a range of 0 to 28, with scores categorized as follows: 0-7 (normal), 8-14 (sub-threshold insomnia), 15-21 (moderate insomnia), and 22-28 (severe insomnia).
In addition, the Epworth Sleep Scale (ESS) [27] was employed to assess daytime hypersomnia. The ESS employs a scoring system that ranges from 0 to 3 to measure the degree of drowsiness experienced in eight different situations. A score of 3 signifies the highest level of sleepiness. The total ESS score ranges from 0 to 24, and a score exceeding 10 is indicative of daytime hypersomnia.
Sample size
The study's sample size was established using the Cochran formula [28]. To arrive at a minimum sample size of 425 students, the following calculation was employed: N = (ZZ (1-P))/(e*e), where N signifies the sample size, Z corresponds to 1.96 for a 95% confidence interval, P represents the estimated prevalence (assumed to be 50% for students exposed and not exposed to traffic noise), and e denotes the marginal error, set at 0.05. A total of 425 students were selected from three primary schools, with 143 students from Saint Dominic, 142 students from Mlandege Primary School, and 140 students from Kitwiru Primary School.
Data analysis
In this study, a series of analyses were conducted to examine various aspects related to the subjects' demographic characteristics and the extent of sleep disturbance they experienced. Firstly, to explore potential differences in demographic characteristics among the groups, ANOVA and Chi-square tests were employed. The Mantel-Haenszel Chi-square test was utilized to investigate whether there was a relationship between the demographic characteristics of the students and the degree of noise exposure to insomnia or daytime hypersomnia.
Finally, to further refine the findings and account for confounding factors, a multiple logistic regression model was applied to variables that demonstrated significance in the univariate analysis. This allowed for the calculation of odds ratios and their respective 95% confidence intervals, shedding light on the impact of exposure degree on insomnia and daytime hypersomnia.
Demographics characteristics of participants
The study comprised a group of 425 students, with approximately 57.9% (n=246) male. Out of these 425 participating students, 33.6% (n=143) were enrolled in private schools, while 66.2% (n=282) enrolled in government schools. Additionally, among the 425 students recruited in the study, 35.5% (n=151) were in class seven (Table 1). On average, the students who participated had an age of 14 years.
Noise levels
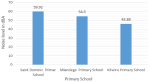
The noise levels at the three primary schools vary. Kitwiru Primary School exhibits lower noise levels, with indoor and outdoor measurements of 43.92 dBA and 47.83 dBA, respectively, resulting in an overall average of 45.88 dBA. Meanwhile, Mlandege Primary School reports slightly higher indoor noise at 52.67 dBA and outdoor noise at 56.33 dBA, with a comprehensive average of 54.5 dBA. Conversely, Saint Dominic Primary School experiences significantly elevated noise levels, with an outdoor reading of 62.83 dBA and an indoor measurement of 57 dBA, culminating in an overall average noise level of 59.92 dBA (Figure 1).
Comparison of demographic attributes across different noise exposure groups
When comparing the gender distribution among the control, low-exposure, and high-exposure groups, it becomes apparent that there are noteworthy differences. In the control group, 57.7% are males, while the low-exposure group closely follows with 57.6% males. The high-exposure group has the highest percentage of males at 58.2%. These variations highlight a statistically significant difference in sex distribution among the groups (p-value = 0.004), indicating that noise exposure might play a role in gender composition within the study (Table 2).
A comparative analysis of age categories reveals significant disparities across the three groups. The control group has 31.0% in the 5-9 age category, followed by 42.3% in the 10-14 age category and 26.7% in the 15-19 age category. In the low-exposure group, 43.2% fall within the 10-14 age category, which is notably higher than the control group. Meanwhile, the high-exposure group features 44.6% in the 10-14 age category, reflecting a substantial difference from the control group. These distinctions underscore a statistically significant variation in age category distribution among the groups (p-value = 0.008).
Comparing the distribution of students across different classes highlights intriguing findings. In the control group, Class 5, Class 6, and Class 7 are evenly represented at around 33% each. However, in the low-exposure group, Class 7 stands out with 36.1%, while the high-exposure group follows a similar trend with 36.7% in Class 7. These differences indicate a statistically significant variation in class distribution among the groups (p-value = 0.037), suggesting a potential impact of noise exposure on class assignments.
When examining the presence or absence of regular exercise habits, a comparison unveils notable distinctions. The control group displays 62.0% engagement in regular exercise, whereas the low-exposure group exhibits the highest participation at 63.9%. In contrast, the high-exposure group lags slightly behind with 60.0% engaging in regular exercise. These variations signify a statistically significant difference in exercise habits among the groups (p-value = 0.027), implying that noise exposure may influence students' tendencies to adopt regular exercise routines.
Insomnia Severity Index (ISI) and Epworth Sleepiness Scale (ESS) results based on subject characteristics
When exploring the association between sex and sleep disturbance, it becomes evident that males exhibit a higher incidence of normal ISI scores in contrast to females. To be specific, 57.7% of males display normal ISI scores, whereas this category encompasses 42.3% of females. Conversely, a greater proportion of females (36.8%) than males (36.2%) exhibit sub-threshold insomnia scores. Furthermore, both males (50.1%) and females (49.1%) predominantly record normal scores on the ESS, signifying a lower prevalence of daytime hypersomnia. Remarkably, there exists no significant disparity in ESS scores between the two genders. Likewise, age categories exert an influence on sleep disturbances. Younger individuals aged 5-9 tend to manifest a higher prevalence of normal ISI scores (30.2%) compared to their older counterparts. In contrast, those falling within the 10-14 age category display a heightened incidence of sub-threshold insomnia (60.2%) relative to other age groups. The 15-19 age group, in contrast, demonstrates a relatively lower percentage of normal ISI scores (9.7%) but a greater percentage of moderate insomnia (28.0%). Concerning ESS scores, individuals aged 5-9 have the lowest prevalence of daytime hypersomnia (46.3%), whereas those aged 15-19 exhibit the highest prevalence (16.7%).
Moreover, class categories unveil variations in sleep disturbances. Notably, students in Class 7 present a higher prevalence of normal ISI scores (48.2%) compared to their peers in other classes, while those in Class 5 and Class 6 register higher percentages of sub-threshold insomnia. Intriguingly, students in Class 7 do not report any cases of severe insomnia according to the ISI. Concerning ESS scores, Class 5 records the highest prevalence of daytime hypersomnia (72.2%), while Class 7 reports none. Furthermore, regular exercise appears to yield positive implications for sleep. Those engaging in regular exercise exhibit a higher prevalence of normal ISI scores (60.0%) compared to individuals who do not partake in regular physical activity (38.3%). Additionally, those adhering to a consistent exercise regimen display a reduced prevalence of daytime hypersomnia (87.0%) in contrast to their sedentary counterparts (13.0%).
Multiple logistic regression model for Insomnia Severity Index (ISI) according to subject characteristics
The analysis of the dataset revealed that gender plays a significant role in insomnia severity. In the unadjusted analysis, females had 1.07 times higher odds of experiencing insomnia compared to males (OR: 1.07, 95% C.I.: 1.02-2.33, p-value: 0.043). This initial finding indicated a gender-related difference in insomnia prevalence. However, even after adjusting for other relevant variables, the association persisted. Females still exhibited a higher likelihood of insomnia, with an adjusted odds ratio of 1.19 (95% C.I.: 1.01-2.40) and a statistically significant p-value of 0.018.
The age of participants also emerged as a significant factor influencing insomnia severity. In the unadjusted analysis, those in the 10-14 age category had significantly higher odds of insomnia compared to the reference group (5-9 years old) with an OR of 2.04 (95% C.I.: 1.08-2.00, p-value: 0.014). Similarly, the 15-19 age category also showed higher odds of insomnia (OR: 1.25, 95% C.I.: 1.12-2.16, p-value: 0.021). Importantly, even after adjusting for other variables, these associations remained significant. The 10-14 age category had an adjusted OR of 2.88 (95% C.I.: 1.38-2.13, p-value: 0.010), and the 15-19 age category had an adjusted OR of 1.72 (95% C.I.: 1.12-2.42, p-value: 0.017).
The level of noise exposure demonstrated a noteworthy impact on insomnia. In the unadjusted analysis, low noise exposure was associated with lower odds of insomnia (OR: 0.87, 95% C.I.: 0.67-0.97, p-value: 0.014), while high noise exposure was associated with higher odds of insomnia (OR: 1.70, 95% C.I.: 1.05-2.11, p-value: 0.024). Even after adjusting for other variables, these associations remained statistically significant. Low noise exposure had an adjusted OR of 0.88 (95% C.I.: 0.55-0.99, p-value: 0.012), and high noise exposure had an adjusted OR of 1.87 (95% C.I.: 1.06-2.98, p-value: 0.024).
While class and regular exercise initially showed significant associations with insomnia in the unadjusted analysis, these associations lost significance after adjusting for other variables. Class 6 and class 7 exhibited different odds of insomnia in the unadjusted analysis (OR: 1.37, 95% C.I.: 1.23-1.83, p-value: 0.019, and OR: 0.45, 95% C.I.: 0.11-0.81, p-value: 0.021, respectively). However, in the adjusted analysis, the p-values for both class 6 and class 7 were not statistically significant, indicating that their associations with insomnia severity were not significant once other variables were considered. Similarly, in the unadjusted analysis, participants who did not engage in regular exercise had lower odds of insomnia (OR: 0.36, 95% C.I.: 0.22-0.89, p-value: 0.014). Nevertheless, after adjustment, the association remained significant, with non-exercisers having an adjusted OR of 0.33 (95% C.I.: 0.31-0.97, p-value: 0.038).
Multiple logistic regression model for Epworth Sleepiness Scale (ESS) according to subject characteristics
Multiple logistic regression analysis indicates that several factors, including gender, age, noise exposure, class, and regular exercise, are associated with daytime sleepiness as measured by the ESS. Females are less likely to experience excessive daytime sleepiness compared to males. Older age categories, higher noise exposure, higher class levels, and not engaging in regular exercise are associated with an increased likelihood of daytime sleepiness.
The analysis reveals that gender significantly impacts daytime sleepiness, as measured by the ESS. In the unadjusted analysis, females exhibited remarkably lower odds of experiencing excessive daytime sleepiness, with an odds ratio (OR) of 0.08 (95% C.I.: 0.02-0.33, p-value: 0.034). Even after adjusting for other relevant variables, the association remained, with females having an adjusted OR of 0.19 (95% C.I.: 0.02-0.40) and a statistically significant p-value of 0.021. This suggests that females are substantially less likely to experience excessive daytime sleepiness compared to males.
Age emerges as another influential factor affecting daytime sleepiness. In the unadjusted analysis, participants in the 10-14 age category demonstrated higher odds of daytime sleepiness compared to the reference group (5-9 years old) with an OR of 1.04 (95% C.I.: 1.04-1.50, p-value: 0.041). Similarly, the 15-19 age category showed higher odds of daytime sleepiness (OR: 1.45, 95% C.I.: 1.11-1.66, p-value: 0.022). These associations remained significant even after adjusting for other variables. The 10-14 age category had an adjusted OR of 1.88 (95% C.I.: 1.43-1.99, p-value: 0.034), and the 15-19 age category had an adjusted OR of 1.22 (95% C.I.: 1.12-2.22, p-value: 0.033).
The level of noise exposure is another significant factor influencing daytime sleepiness. In the unadjusted analysis, low noise exposure was associated with lower odds of daytime sleepiness (OR: 0.57, 95% C.I.: 0.42-0.77, p-value: 0.029), while high noise exposure was associated with higher odds of daytime sleepiness (OR: 1.40, 95% C.I.: 1.01-2.41, p-value: 0.037). These associations remained statistically significant after adjustment. Low noise exposure had an adjusted OR of 0.68 (95% C.I.: 0.54-0.99, p-value: 0.019), and high noise exposure had an adjusted OR of 1.77 (95% C.I.: 1.04-1.98, p-value: 0.014). This suggests that noise exposure levels are closely related to variations in daytime sleepiness.
Participants' class levels and engagement in regular exercise were initially observed to have significant associations with daytime sleepiness in the unadjusted analysis. Specifically, participants in class 6 exhibited higher odds of daytime sleepiness compared to class 5 (OR: 1.47, 95% C.I.: 1.23-1.93, p-value: 0.018), and the same trend was observed for class 7 (OR: 1.45, 95% C.I.: 1.11-2.81, p-value: 0.011). However, in the adjusted analysis, these associations lost statistical significance as indicated by the non-significant p-values for class 6 and class 7. This suggests that class levels did not independently influence daytime sleepiness when accounting for other variables in the model. Conversely, with regards to regular exercise, in the unadjusted analysis, participants who did not engage in regular exercise had lower odds of experiencing daytime sleepiness (OR: 0.46, 95% C.I.: 0.18-0.89, p-value: 0.032). Even after adjusting for other variables, the association remained significant, with non-exercisers having an adjusted OR of 0.63 (95% C.I.: 0.41-0.98, p-value: 0.030). This finding implies that regular exercise is associated with a reduced likelihood of experiencing daytime sleepiness, independent of other factors considered in the model.
Ethical considerations
This study adhered to the policies and procedures established by the Ruaha Catholic University Review Board (RCURB) at Ruaha Catholic University. This clearance signifies that the study's design, methods, and procedures underwent a comprehensive review and received approval from the RCURB, ensuring the protection of the rights and well-being of study participants and the ethical conduct of the research. For participants under the age of 18, informed consent was obtained from their legal guardians. In addition to obtaining consent from guardians, we also sought assent from the children themselves, ensuring that they understood the study's purpose and procedures to the best of their ability. We used age-appropriate language and explanations to facilitate understanding among child participants. Furthermore, in addition to securing clearance from the Institutional Review Board, the study also obtained authorization from the District Executive Director (DED) to collect data within a school. Additionally, permission was sought and obtained from the School Head teachers before commencing any interviews at their respective schools.
The students exposed to higher noise level group demonstrated significantly high scores on both the Insomnia Severity Index (ISI) and the Epworth Sleepiness Scale (ESS) compared to the control group. Furthermore, a significantly higher percentage of students residing in the highly exposed area, as opposed to the non-exposed control group, were categorized as experiencing insomnia and daytime hypersomnia based on the results of the ISI and ESS. The problem of insomnia appeared to be more prevalent during the nighttime compared to daytime hypersomnia. The multiple logistic regression model that accounted for various factors, including gender, age, education level, regular exercise, and class level, showed that students within the high-exposure group have approximately 2 times higher risk of insomnia and daytime hypersomnia in the subjects compared to students subjects within the control area.
The mean noise levels across three different exposure areas showed significant differences. The control group recorded the lowest noise level at 45.88 dBA, followed by the low exposure group at 54.5 dBA, and the high exposure group at 59.92 dBA. Nighttime traffic noise tends to disrupt students' sleep more significantly due to reduced background noise, making traffic noise more prominent. Additionally, people are generally more sensitive to noise at night when they anticipate a quieter environment. This can lead to sleep disturbances, impacting the well-being of students residing in areas with high exposure to road traffic noise. Noise levels were measured using a digital sound level meter with a weighting system, while insomnia and hypersomnia were assessed using the ISI and ESS, respectively. Consequently, it can be assumed that road traffic noise directly influences the sleep patterns of students in high-exposure areas (Table 3, Table 4).
Previous studies have confirmed that continuous exposure to noise increases the risk of sleep disturbance [29-31]. Some studies, have assessed the relationship between road traffic noises and sleep disturbance [32,33]. The results in this study indicated poor sleep quality among students exposed to road traffic noise, with an elevated risk of sleep disturbance.
Sleep is also influenced by the sex and age of a student [34]. In this study, female and older students showed significant results in terms of their association with sleep disturbance. Pregnancy leads to significant changes in sleep patterns for females due to hormonal fluctuations, discomfort, and the need for more frequent nighttime. The recommended amount of sleep varies with age. Newborns and infants require the most sleep, while the amount gradually decreases as individuals age. Older adults find it more challenging to get a full night's sleep due to changes in sleep architecture and increased awakenings during the night. The multiple logistic regression model results showed a statistical significance after the adjustment of these variables.
There is a notable connection between students' education level, class standing, and the presence of sleep disturbances [35,36]. Our study showed education level and class level for students associated with higher prevalence of sleep disturbance. Noise disturbance have adverse health effects, including increased stress, sleep disturbances, and cardiovascular issues [30]. Education influences an individual's health literacy, enabling them to better understand and address the health consequences of noise exposure. Additionally, students with higher levels of education often have a better understanding of the potential health and quality of life impacts of noise disturbance. Interestingly, students in higher-grade levels exhibited lower noise levels in the high-exposure group, possibly indicating increased awareness of the effects of road traffic noise.
Lastly, regular exercise showed a significant association with the occurrence of insomnia and daytime hypersomnia in the multivariate analysis. Students who engaged in regular exercise showed a lower prevalence of insomnia, which is similar with the general understanding that regular exercise improves sleep quality [37,38]. Exercise has stress-reducing and anxiety-relieving effects, which are common contributors to sleep disturbances exercise has stress-reducing and anxiety-relieving effects, which are common contributors to sleep disturbances [39]. Student engaging in physical activity triggers the release of endorphins, natural mood enhancers that promote relaxation and reduce tension.
Sleep disturbance due to road traffic noise is a critical public health concern, particularly when considering the primary schools involved in this study and situated in close proximity to traffic high-traffic areas. This proximity intensifies the severity of sleep-related issues. Both daytime and nighttime traffic services directly affect students' sleep patterns, underscoring the need for appropriate measures to address this situation. Consequently, it is imperative to contemplate and implement suitable measures in response to this situation.
One potential limitation of the study is the possibility of sampling bias. The focus on specific schools or regions may introduce a directional bias, the selected schools may not representative of the broader student population. The magnitude of this bias could affect the generalizability of the findings, limiting their application to a broader demographic. Another consideration is the reliance on self-reported data, which might introduce recall or social desirability bias. The direction of this bias could lead to underreported or socially acceptable responses, impacting the accuracy of associations, particularly for subjective measures such as regular exercise. The magnitude of this bias depends on the participants' honesty and memory accuracy.
Road traffic noise poses a critical concern, particularly in the context of its impact on students' sleep patterns. This study has shed light on the significant relationship between road traffic noise exposure and sleep disturbances, particularly insomnia and daytime hypersomnia. The study found a significant association between noise exposure and sleep disturbance among students. Students exposed to road traffic noise group had higher scores on both the Insomnia Severity Index (ISI) and the Epworth Sleepiness Scale (ESS) compared to the control group. Collaboration with local authorities is crucial to implement effective traffic management strategies, particularly during school hours. Initiatives such as reducing speed limits and optimizing traffic flow around school zones can significantly reduce noise pollution near educational institutions, safeguarding students' sleep patterns. It is advisable to conduct further research that includes direct noise measurements and utilizes objective sleep evaluation methods. This approach will help provide a more comprehensive understanding of the cause-and-effect relationship in this context.
What is known about this topic
- Increased awareness of sleep disturbances: there is a growing awareness of the potential impact of external factors on the sleep patterns of individuals, particularly in urban settings with high traffic volumes;
- Potential health implications: understanding how sleep disturbances in primary school students may relate to long-term health outcomes is an essential aspect of the study's context; this could involve exploring associations with cognitive development, academic performance, and overall well-being in the context of noise exposure;
- Age group sensitivity: the research likely aligns with prior findings indicating that certain age groups, such as primary school students, may be more vulnerable to the effects of noise on sleep; understanding this age-specific sensitivity is crucial for tailoring interventions and policies that address the unique needs of children in the educational environment.
What this study adds
- Specific insights for Iringa Municipality: this study adds valuable insights specific to Iringa Municipality, contributing localized data on the relationship between road traffic noise and sleep disturbance in primary school students; this region-specific information can inform targeted interventions and policies to address the unique challenges faced by students in Iringa;
- Comprehensive understanding of sleep disturbance factors: by incorporating factors such as demographics, exercise habits, and class distribution, this study provides a more comprehensive understanding of the various elements that contribute to sleep disturbances in primary school students. This nuanced approach enhances the study's relevance and applicability to real-world scenarios;
- Implications for traffic management strategies: the study adds practical implications for local authorities and policymakers, emphasizing the importance of considering noise reduction measures to promote better sleep quality among students in high-traffic areas.
The authors declare no competing interests.
We express our profound gratitude to Budodi Walwa Walwa, Tulamwona Exaud Dumulinyi, Abdallah Shaban Mahia, and Clara Abraham Macha for their indispensable and noteworthy contributions to this research endeavor. Budodi Walwa Walwa assumed a pivotal role in multiple facets of this study, encompassing study design, the acquisition and curation of data, meticulous data entry and analysis, the discernment of results, and the composition of the manuscript. Moreover, Tulamwona Exaud Dumulinyi, Abdallah Shaban Mahia, and Clara Abraham Macha made substantial and commendable contributions to this investigation. They actively engaged in the formulation of the research's design, offering diligent oversight and expert guidance throughout the entire research process. Their substantial expertise and valuable perspectives enriched the study's methodological framework, thereby fortifying the robustness of the obtained results. Additionally, their roles in the critical appraisal and refinement of the manuscript were instrumental. All authors have read and agreed to the final manuscript.
We wish to extend our heartfelt gratitude and profound appreciation to all the participants who graciously devoted their time and actively participated in this research endeavor. Without their willing engagement and willingness to share their experiences, the realization of this study would have been unattainable. Their invaluable insights and cooperative spirit have significantly enriched our research. Additionally, we would like to express our thanks to the diligent research assistants who assumed a pivotal role in executing surveys and acquiring essential data. Their unwavering dedication, professional conduct, and meticulous attention to detail ensured the seamless execution of the research. Their indispensable efforts in administering surveys and facilitating participant interactions made a substantial contribution to the overall success of this research project.
Furthermore, we extend our profound appreciation to the entire staff of the Ruaha Catholic University for their consistent support and guidance throughout the duration of this study. Their technical expertise, valuable contributions, and moral encouragement played a pivotal role in shaping the research's trajectory and navigating various challenges that arose. We are genuinely grateful for their unwavering commitment and assistance which proved to be indispensable in bringing this study to fruition.
We wish to acknowledge that this study did not receive external financial support. The research was conducted without funding from external agencies or sponsors. We extend our sincere gratitude to the participants, research assistants, and Ruaha Catholic University for their invaluable contributions and unwavering support throughout the study.
Table 1: general characteristics and Insomnia Severity Index (ISI)/Epworth Sleepiness Scale (ESS) results by noise exposure groups
Table 2: Insomnia Severity Index (ISI) and Epworth Sleepiness Scale (ESS) results based on subject characteristics
Table 3: multiple logistic regression model for Insomnia Severity Index (ISI) according to subject characteristics
Table 4: multiple logistic regression model for Epworth Sleepiness Scale (ESS) according to subject characteristics
Figure 1: assessment of the average noise level within three primary schools
- King EA. Here, there, and everywhere: How the SDGs must include noise pollution in their development challenges. Environ Sci Policy Sustain Dev. 2022;64(3):17-32. Google Scholar
- Jacyna M, Wasiak M, Lewczuk K, Karo´ G. Noise and environmental pollution from transport: decisive problems in developing ecologically efficient transport systems. J Vibroengineering. 2017;19(7):5639-55. Google Scholar
- Baffoe PE, Duker AA, Senkyire-Kwarteng EV. Assessment of health impacts of noise pollution in the Tarkwa Mining Community of Ghana using noise mapping techniques. Glob Heal J. 2022;6(1):19-29. Google Scholar
- Moroe N, Mabaso P. Quantifying traffic noise pollution levels: a cross-sectional survey in South Africa. Sci Rep. 2022 Mar 2;12(1):3454. PubMed | Google Scholar
- Hedblom M, Gunnarsson B, Schaefer M, Knez I, Thorsson P, Lundström JN. Sounds of Nature in the City: No Evidence of Bird Song Improving Stress Recovery. Int J Environ Res Public Health. 2019 Apr 17;16(8):1390. PubMed | Google Scholar
- Münzel T, Miller MR, Sørensen M, Lelieveld J, Daiber A, Rajagopalan S. Reduction of environmental pollutants for prevention of cardiovascular disease: it's time to act. Eur Heart J. 2020 Nov 1;41(41):3989-3997. PubMed | Google Scholar
- Imbens GW. Potential outcome and directed acyclic graph approaches to causality: Relevance for empirical practice in economics. J Econ Lit. 2020;58(4):1129-79. Google Scholar
- Gilani TA, Mir MS. A study on the assessment of traffic noise induced annoyance and awareness levels about the potential health effects among residents living around a noise-sensitive area. Environ Sci Pollut Res Int. 2021 Nov;28(44):63045-63064. PubMed | Google Scholar
- Dzhambov AM, Dimitrova DD. Children's blood pressure and its association with road traffic noise exposure - A systematic review with meta-analysis. Environ Res. 2017 Jan;152:244-255. PubMed | Google Scholar
- Evans GW, Brooks-Gunn J, Klebanov PK. Stressing out the poor. In: Social Stratification. Routledge; 2018. p. 423-30.
- Steele JL, Slater RO, Zamarro G, Miller T, Li J, Burkhauser S, Bacon M. Effects of dual-language immersion programs on student achievement: Evidence from lottery data. Am Educ Res J. 2017;54(1_suppl):282S-306S. Google Scholar
- Cabbage KL, Farquharson K, Iuzzini-Seigel J, Zuk J, Hogan TP. Exploring the Overlap Between Dyslexia and Speech Sound Production Deficits. Lang Speech Hear Serv Sch. 2018 Oct 24;49(4):774-786. PubMed | Google Scholar
- Secchi S, Astolfi A, Calosso G, Casini D, Cellai G, Scamoni F, Scrosati C, Shtrepi L. Effect of outdoor noise and façade sound insulation on indoor acoustic environment of Italian schools. Appl Acoust. 2017;126:120-30. Google Scholar
- Osher D, Cantor P, Berg J, Steyer L, Rose T. Drivers of human development: How relationships and context shape learning and development 1. In: The Science of Learning and Development. Routledge; 2021. p. 55-104. Google Scholar
- Str�hl AN. Insomnia in modern world. University of Zagreb. School of Medicine; 2023. Google Scholar
- Micic G, Zajamsek B, Lack L, Hansen K, Doolan C, Hansen C, et al. A review of the potential impacts of wind farm noise on sleep. Acoust Aust. 2018;46:87-97. PubMed | Google Scholar
- Baranwal N, Yu PK, Siegel NS. Sleep physiology, pathophysiology, and sleep hygiene. Prog Cardiovasc Dis. 2023 Mar-Apr;77:59-69. PubMed | Google Scholar
- Gulia KK, Kumar VM. Sleep disorders in the elderly: a growing challenge. Psychogeriatrics. 2018;18(3):155-65. PubMed | Google Scholar
- Astolfi A, Puglisi GE, Murgia S, Minelli G, Pellerey F, Prato A, et al. Influence of Classroom Acoustics on Noise Disturbance and Well-Being for First Graders. Front Psychol. 2019 Dec 13;10:2736. PubMed | Google Scholar
- Akpamah P, Matkó A. Information Technology deployment in Human Resource Management: A case study in deprived regions. Int Rev Appl Sci Eng. 2022;13(1):1-10. Google Scholar
- Chere B, Kirkham N. The negative impact of noise on adolescents' executive function: an online study in the context of home-learning during a pandemic. Front Psychol. 2021;12:715301. PubMed | Google Scholar
- Caviola S, Visentin C, Borella E, Mammarella I, Prodi N. Out of the noise: Effects of sound environment on maths performance in middle-school students. J Environ Psychol. 2021;73:101552. Google Scholar
- Song H, Kim M, Park D, Shin Y, Lee JG. Learning From Noisy Labels With Deep Neural Networks: A Survey. IEEE Trans Neural Netw Learn Syst. 2023 Nov;34(11):8135-8153. PubMed | Google Scholar
- Han B, Yao Q, Yu X, Niu G, Xu M, Hu W, et al. Co-teaching: Robust training of deep neural networks with extremely noisy labels. Adv Neural Inf Process Syst. 2018;31. Google Scholar
- Marway OS, Lau PH, Carmona NE, Carney CE. What are patients completing Cognitive Behavioral Insomnia Therapy telling us with their post-treatment Insomnia Severity Index scores? Sleep Med. 2023 Mar;103:187-194. Google Scholar
- Wong ML, Lau KNT, Espie CA, Luik AI, Kyle SD, Lau EYY. Psychometric properties of the Sleep Condition Indicator and Insomnia Severity Index in the evaluation of insomnia disorder. Sleep Med. 2017 May;33:76-81. PubMed | Google Scholar
- Mairesse O, Damen V, Newell J, Kornreich C, Verbanck P, Neu D. The Brugmann Fatigue Scale: An Analogue to the Epworth Sleepiness Scale to Measure Behavioral Rest Propensity. Behav Sleep Med. 2019 Jul-Aug;17(4):437-458. PubMed | Google Scholar
- Ahmad H, Halim H. Determining sample size for research activities. Selangor Bus Rev. Mar. 2024;2(1):20-4. Google Scholar
- Basner M, Clark C, Hansell A, Hileman JI, Janssen S, Shepherd K, Sparrow V. Aviation Noise Impacts: State of the Science. Noise Health. 2017 Mar-Apr;19(87):41-50. PubMed | Google Scholar
- Jariwala HJ, Syed HS, Pandya MJ, Gajera YM. Noise pollution & human health: a review. Noise and Air Pollutions: Challenges and Opportunities, Ahmedabad: LD College of Eng. 2017 Mar. Google Scholar
- Riedy SM, Smith MG, Rocha S, Basner M. Noise as a sleep aid: A systematic review. Sleep Med Rev. 2021;55:101385. PubMed | Google Scholar
- Skrzypek M, Kowalska M, Czech EM, Niewiadomska E, Zejda JE. Impact of road traffic noise on sleep disturbances and attention disorders amongst school children living in Upper Silesian Industrial Zone, Poland. Int J Occup Med Environ Health. 2017 May 8;30(3):511-20. PubMed | Google Scholar
- Weyde KV, Krog NH, Oftedal B, Evandt J, Magnus P, Øverland S, et al. Nocturnal road traffic noise exposure and children´s sleep duration and sleep problems. Int J Environ Res Public Health. 2017;14(5):491. PubMed | Google Scholar
- Dinis J, Bragança M. Quality of Sleep and Depression in College Students: A Systematic Review. Sleep Sci. 2018 Jul-Aug;11(4):290-301. PubMed | Google Scholar
- Jalali R, Khazaei H, Paveh BK, Hayrani Z, Menati L. The Effect of Sleep Quality on Students' Academic Achievement. Adv Med Educ Pract. 2020 Jul 17;11:497-502. PubMed | Google Scholar
- Lawson HJ, Wellens-Mensah JT, Attah Nantogma S. Evaluation of Sleep Patterns and Self-Reported Academic Performance among Medical Students at the University of Ghana School of Medicine and Dentistry. Sleep Disord. 2019 Jun 11;2019:1278579. PubMed
- Sejbuk M, Mironczuk-Chodakowska I, Witkowska AM. Sleep Quality: A Narrative Review on Nutrition, Stimulants, and Physical Activity as Important Factors. Nutrients. 2022 May 2;14(9):1912. PubMed | Google Scholar
- Wang F, Bíró É. Determinants of sleep quality in college students: A literature review. Explore (NY). 2021 Mar-Apr;17(2):170-177. PubMed | Google Scholar
- Besson NA. Climbing Out of Limbic: When anxiety takes hold, children default to their brain's fear-focused limbic system. And learning stops short. ASHA Lead. 2017;22(9):54-9. Google Scholar
Search
This article authors
On Pubmed
On Google Scholar
Citation [Download]
Navigate this article
Similar articles in
Key words
Tables and figures
Article metrics

